

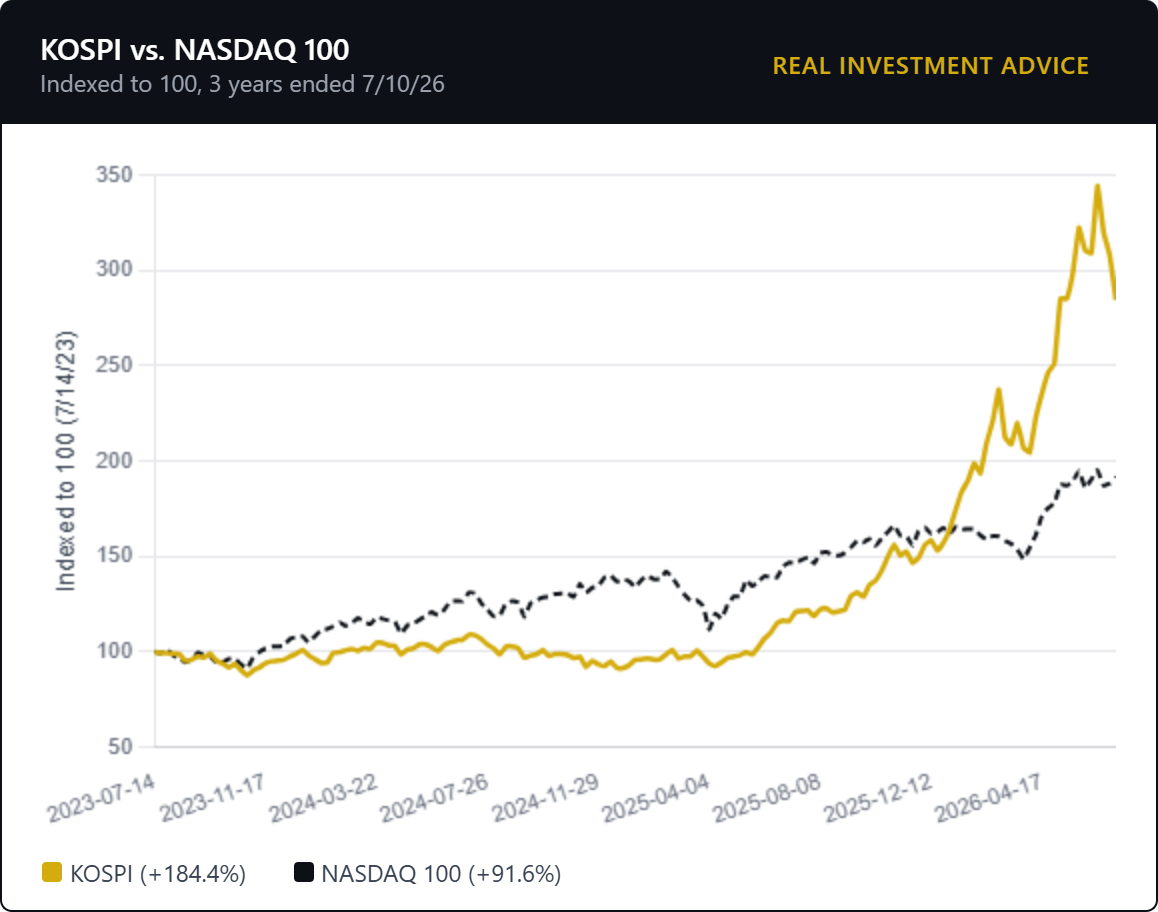
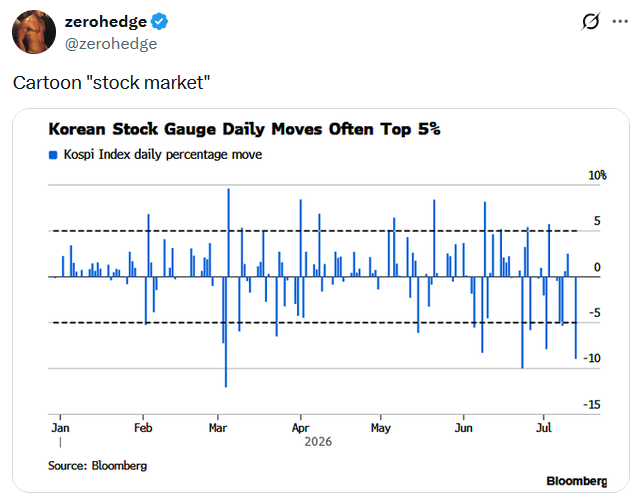
Semiconductor chip companies have been benefiting from strong momentum and a powerful narrative. For instance, memory chip producers like Micron, AMD, and Intel have risen by 192%, 138%, and 166%, respectively, year to date. While they provided a nice boost to the Nasdaq and an impressive, albeit lesser, tailwind to the S&P 500, the impact of Korean chipmakers on the Korean Composite Stock Price Index (KOSPI) has been stunning.
Consider the graph below, showing that the KOSPI has grossly outperformed the Nasdaq over the last three years. Incredibly, most of the KOSPI gains have occurred over the last year. Since the beginning of 2026 alone, the index has surged more than 88%. The KOSPI is now up over 200% in the last two years.
The reason for its parabolic ascent is two stocks. As of June 30, 2026, Samsung Electronics and SK Hynix together account for nearly 60% of the KOSPI, up from roughly 40% just two years ago. For context, Nvidia and Apple combined account for only about 20% of the Nasdaq.
The concentration carries serious risks. One such risk is regulatory. Goldman Sachs warns that if the combined KOSPI weight rises by just one more percentage point, foreign institutional investors subject to US Investment Company Act diversification rules will be forced to sell.
The KOSPI is no longer a gauge of South Korea or its financial markets. It is a bet on the global AI infrastructure buildout, packaged as a country index.
What To Watch Today
Earnings
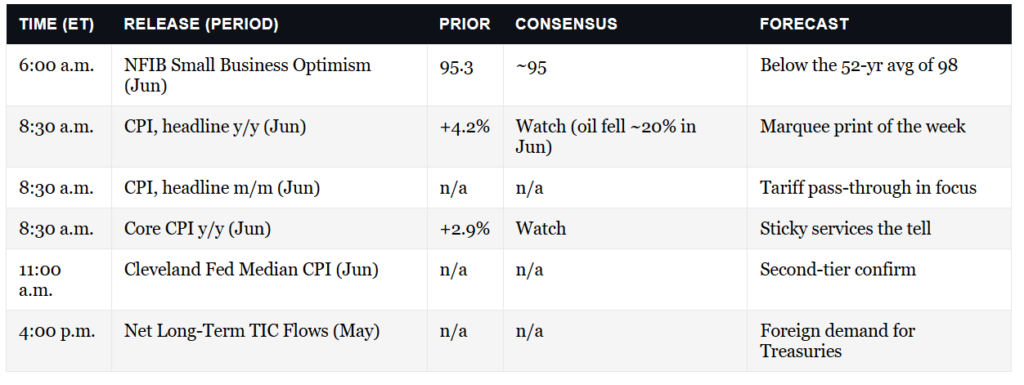
Economy
Fed Speakers
Chair Kevin Warsh delivers the semiannual monetary policy testimony before the House Financial Services Committee at 10:00 a.m. ET, roughly 90 minutes after the CPI print. His debut testimony as Chair, with the Senate Banking hearing to follow on July 15. The Fed is not yet in its pre-FOMC blackout.
Market Trading Update
Yesterday, I discussed the technical backdrop coming into this trading week and published a piece on why spotting market bubbles is nearly impossible in real time. If you didn’t read it, I want to recap on it today, as it is important given some of the prognostications running through the media, and there is one image that keeps landing in my inbox. It’s the AI bubble analog: today’s Nasdaq laid on top of the 1998 to 2001 Nasdaq, scaled so the two curves march up the page together. The caption always reads some version of “deja vu.” Look at it for three seconds, and the conclusion writes itself.
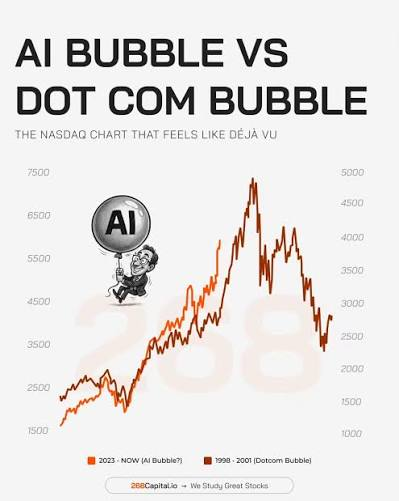
Here’s the problem with that chart. It’s a magic trick built from two y-axes. The left axis runs the modern Nasdaq from 10,000 to 26,000. The right axis runs the old one from 1,000 to 5,000. Stretch and squeeze the scales until the curves kiss, and any two rising markets will look like twins. Shape is not substance.
The differences from 1999 are real, and they matter. In March 2000, dozens of marquee Nasdaq names had no earnings, no cash flow, and a business model built on burning venture money to buy eyeballs. Pets.com had about nine months of cash in the tank when it went public. Cisco, the most valuable company in the world at the peak, traded north of 100 times trailing earnings. That was a market priced on stories.
Today’s leaders are a different animal. Nvidia, Microsoft, Alphabet, and Meta generate enormous free cash flow. Nvidia alone booked tens of billions in operating profit last quarter. The technology is REAL, and so are the profits underneath the biggest names. A bubble built on hope pops one way. A bubble built on real but over-extrapolated earnings pops another. That distinction is the whole ballgame for how much damage a reset actually does.
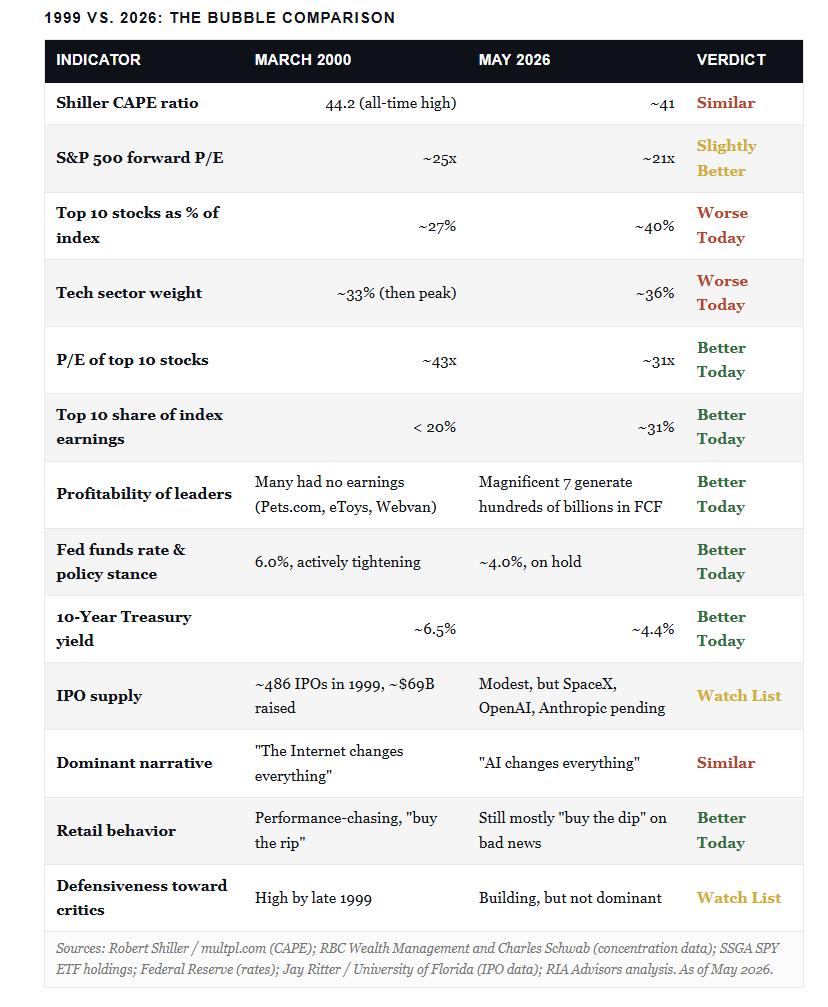
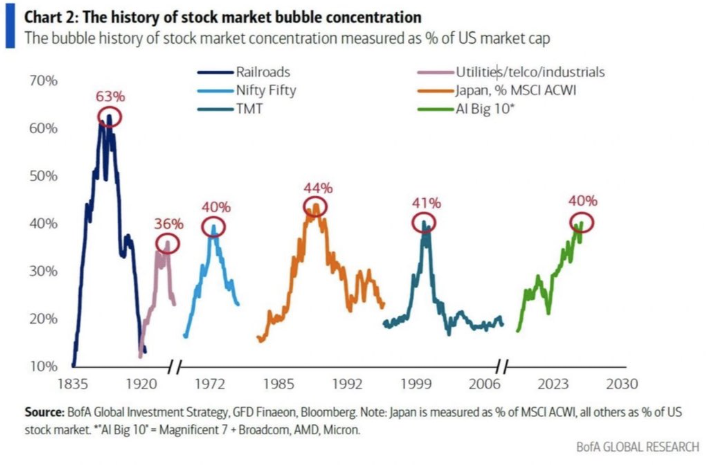
Read that scorecard the right way. It’s not a green light, and it’s not 1999 wearing a costume. It’s a stretched market with one dominant story and severe concentration, sitting atop profitability, policy, and retail behavior that are all in better shape than they were at the last comparable top. The piece that worries me more than the headline multiple is that concentration. When a handful of names drive most of the index return, you don’t own a diversified portfolio anymore.
Bubbles, real or imagined, create a behavioral problem more than a portfolio problem. Investors flip from all-in to all-out on the week’s headlines, and both extremes are usually wrong. Stocks aren’t a light switch. The decision is rarely between fully invested and fully in cash, so stop framing it that way.
Four rules have carried through every prior cycle.
Stay invested in a diversified mix you can defend in any tape.
Trim what’s run, add to what hasn’t.
Hold meaningful positions in assets that behave differently from the popular trade, including bonds, value stocks, and, most importantly, cash, which gives you an opportunity.
Above all, define in advance what would force you to reduce risk, and write it down.
I’ve argued for a while that bonds remain the best stabilizer for most investors, because in a true unwind, when growth and inflation expectations fall together, that negative correlation with stocks tends to reassert itself.
You don’t need to know when the music stops. You need to know what your book looks like when it does. That’s the question to answer this week, well before it turns urgent.
Breadth Improves Post Quarter End
The Heat Map below, courtesy of FinViz, shows that last week was very mixed, with much divergence within sectors. For instance, in the communications sector, Meta was up double digits while Google fell by 2.5%. Similarly, NVDA and AVGO led the semiconductor sector higher by over 5%, while many of the recent chip outperformers, such as MU and INTC, performed poorly. As a result, the market’s breadth improved, with recent outperformers now underperforming and vice versa.
The second graphic from our soon-to-be-released new version of SimpleVisor shows that the sectors are clustered around fair value. Our new dispersion index, which measures breadth, is relatively low, signaling a healthy market. However, while the sectors show lower dispersion relative to each other, there is still considerable dispersion within some sectors.
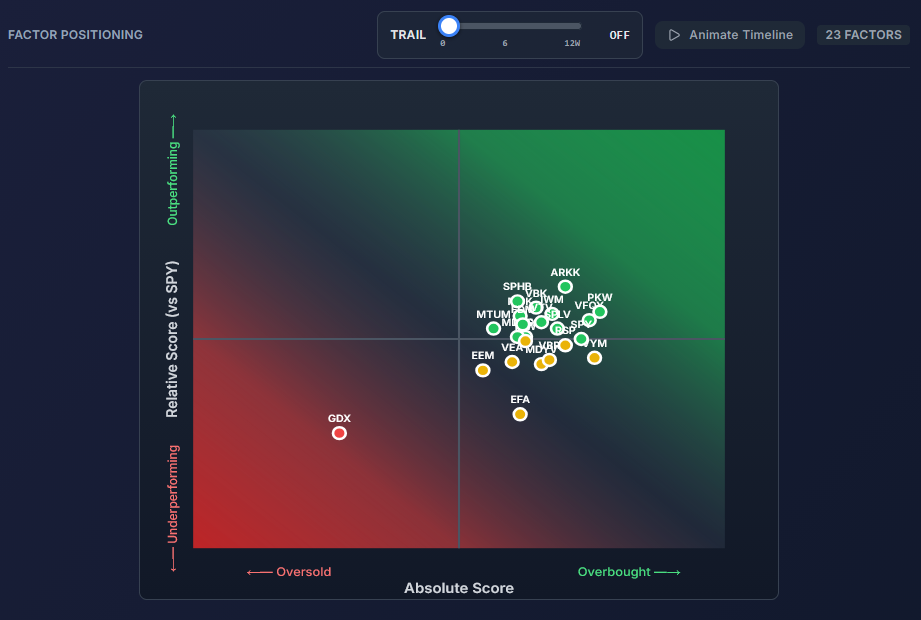
The third graphic shows that the factors are even more clustered, again signaling that market breadth has improved significantly. Of the 23 factors, 20 have relative scores within ±0.20 of fair value.
Spotting Market Bubbles: Why History Says Its Nearly Impossible
If you knew you were standing inside a stock market bubble, you wouldn’t be standing in it for long. You’d sell. So would I, and so would everyone reading this. And if spotting market bubbles was something everyone could do in real time, the bubble couldn’t form in the first place. That paradox is why spotting market bubbles is one of the hardest jobs in finance, and why bubbles look painfully obvious only after the fact.
Market bubbles are not a modern invention. They’ve been a recurring feature of financial life for almost 400 years, ever since the first organized stock exchange opened in Amsterdam in the early 1600s.
The Dutch Tulip Mania of 1636 to 1637 is the textbook case. Tulip bulb prices in the Netherlands soared roughly twentyfold in a few months, then collapsed by about 99% in May 1637. Less than a century later, the South Sea Bubble of 1720 took shares of the South Sea Company from £128 in January to £1,050 in June before collapsing back to near the starting price by year-end. Isaac Newton, often cited as the smartest man of his era, lost a fortune in that one. He’s reputed to have said: “I can calculate the motion of the heavenly bodies, but not the madness of crowds.”
The 20th century gave us bigger versions of the same story. The Roaring Twenties ended with the 1929 crash and a peak-to-trough Dow drawdown of nearly 89% by 1932. Japan’s late-1980s asset bubble carried the Nikkei 225 to 38,915 on December 29, 1989, and triggered a collapse that eventually took the index down more than 80%, with the post-bubble low not arriving until October 2008, nearly 19 years after the peak. Then came the dot-com bubble. Between January 1995 and March 10, 2000, the Nasdaq Composite rose roughly 572% to a peak of 5,048.62. It then fell 78% by October 2002, and didn’t recover its 2000 high until April 2015.
Tweet of the Day



Comments
Log in or sign up to join the conversation.