

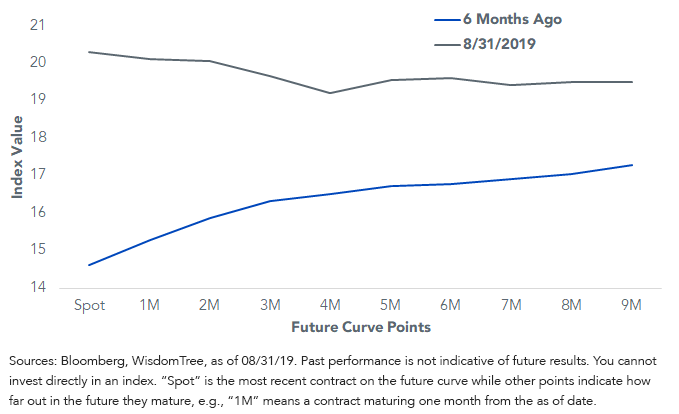
Besides the yield curve that our fixed income team likes to talk about, there is another curve that inverted recently, and that warrants attention from asset allocators in Q4 2019. Typically, the Chicago Board of Options Exchange (Cboe) Volatility Index (VIX) is an upward sloping curve—VIX contracts further out trade higher than the nearer contracts. This means there is more uncertainty as you go further out in the future.
However, in August, this trend reversed, and VIX one-month contracts traded higher than VIX three- and six-months contracts. We can blame this higher near-term uncertainty on trade tensions, slowing growth and Federal Reserve (Fed) policy. In any case, it means risk is back in vogue. For asset allocators, this implies hedging volatility is more critical now than it was earlier this year.
VIX Future Curve
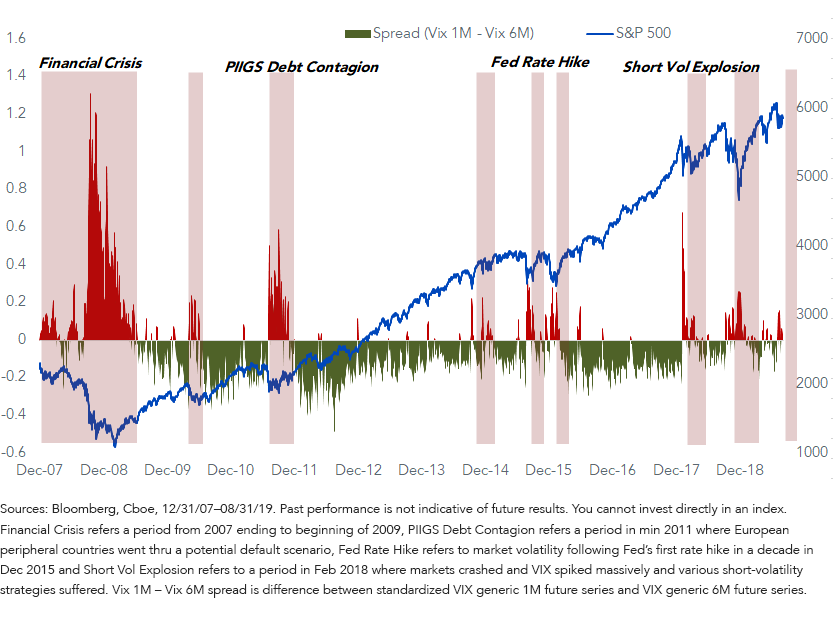
Historically, here’s what an inverted volatility curve has meant:
- Higher volatility in the near term.
- More negative equity swings.
- Higher-income opportunity via selling volatility contracts.
VIX 1M Inversion: Canary in a Coal Mine
(Click on image to enlarge)
How Can WisdomTree Help?
As volatility comes back into the conversation, the WisdomTree CBOE S&P 500 PutWrite Strategy Fund (PUTW), which tracks Cboe’s PutWrite Index (PUT Index) could be a great instrument for providing long exposure with the ability to mitigate downside risk during volatile markets.
A few PUTW highlights:
- During upward trending markets in 2017, PUTW still delivered returns above 10%. The S&P 500 Index was up ~+22%. Please visit PUTW’s Fund detail page for standardized performance.
- Similarly, in 2009, the PUT Index rose 31.5%, outperforming the S&P 500, which returned +26.46%
- PUTW has a beta of approximately ~0.6, thus reducing volatility.
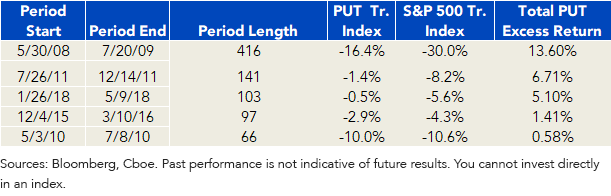
In periods when the VIX curve inverted, the PUT Index has beaten the S&P 500 by a large margin (table below):
Top 5 Longest Periods When Normalized VIX 1M Was Consistently Above Normalized VIX 6M
Conclusion
PUTW can be a great hedge in this environment. If there is a trade resolution or market rally, PUTW’s strong positive correlation to equities could potentially provide positive returns. If markets fall, it can help provide cushioning and income, especially in a more volatile environment. Investors should be cautious of buying either pure short or pure long vol strategies. The former can potentially wipe out total exposure, while the later can act as a drag on total returns due.



Comments
Log in or sign up to join the conversation.