

The housing market’s downward turn begins: new home sales in February, plus a comment about affordability
As of this morning, Mortgage News Daily shows the 30-year mortgage rate up to 4.72%, 1.9% higher than their lows 15 months ago, and the highest in four years. That means the housing market is in some serious trouble. Let’s take a look at that via this morning’s new home sales report for January.
First, a reminder, those new home sales: (1) are the most leading of all housing reports, leading even permits, so much so that it is more of a mid-cycle indicator rather than a long leading indicator, and (2) are very noisy, and heavily revised, so much so that it is less useful than single-family permits in particular.
So first, here are new home sales (blue) vs. single-family permits (red) for the past 5 years:
(Click on image to enlarge)

It’s easy to see that the trend in sales led permits - but also that sales are much noisier.
Here is the longer-term view of the same (excluding the most recent data):
(Click on image to enlarge)
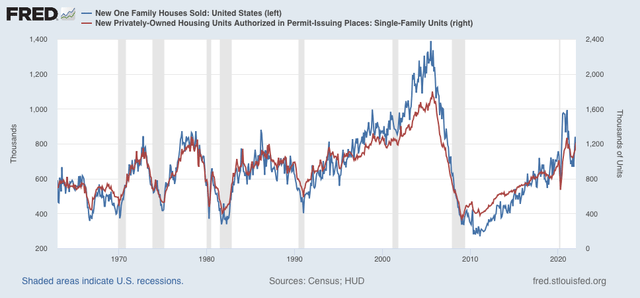
Sales and permits both increased with lower mortgage rates late last year and after a month in which new buyers locked in sales before rates when higher, both have now backed off again.
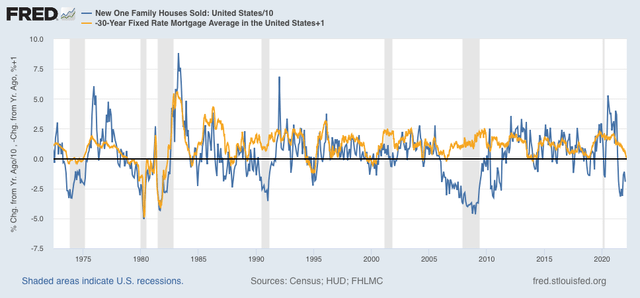
Next, as I always say, interest rates lead to sales. Here is the long term view of the YoY% change in mortgage interest rates (gold, inverted, so that an increase in rates shows as a decrease) vs. the YoY% change (/10 for scale) in new home sales for the past 10 years> Note that I have added 1% to the YoY change in mortgage rates so that only increases in mortgage rates of more than 1% show as a negative:
(Click on image to enlarge)
Here is a close-up of the past 10 years:
(Click on image to enlarge)

It is easy to see that interest rates lead sales by 3-6 months. Note that sales were generally more buoyant than interest rates in the past decade, due to the demographic tailwind of the big Millennial generation, a tailwind that is now abating.
Further, *every* time mortgage rates were higher by more than 1% YoY, new home sales declined YoY at least briefly. But they only correlated with an oncoming recession about 50% of the time. So the increase in interest rates to date by itself does not necessarily signal a recession next year.
Next, sales lead prices. The below graph compares the YoY% changes in sales with that of prices (green):
(Click on image to enlarge)

The YoY change in sales peaked from summer 2020 through spring 2021; prices followed from spring through autumn 2021. Price increases are now clearly decelerating.
Finally, in the case of new houses, prices lead to inventories. The below graph compares sales with new homes for sale (brown), minus the most recent months:
(Click on image to enlarge)
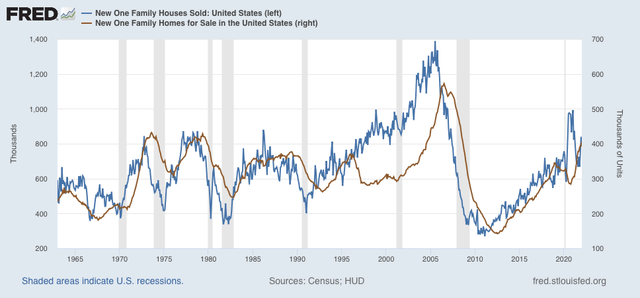
Here is a close-up of the past five years:
(Click on image to enlarge)

The inventory of new single-family houses for sale increased to 407,000 in February, the highest number since summer 2008, and before the housing bubble previously exceeded only during the 1970s.
The housing market has begun its turn downward. In keeping with my mantra, we should expect the continued rise in mortgage rates to lead to a renewed decline in new home sales and construction, continued deceleration with price increases (and an increasing chance of outright price *decreases*) and a continued increase in the inventory of new houses for sale.
Finally, the double whammy of continued price increases and the sharp rise in mortgage rates has major ramifications for overall housing affordability. I wrote about this already over a month ago, and mortgage rates have only continued to rise since. How close are we to housing-bubble-style nosebleed territory? I plan on addressing that on Friday.


Comments
Log in or sign up to join the conversation.