
In the past week or so in the stock market blogosphere there was talk of a head and shoulders pattern forming in gold. Besides the fact that this is an unreliable pattern, the time frame that was used was a daily chart. Since this pattern is typically used to signal a reversal in trend, in my opinion, a weekly chart is much more appropriate.
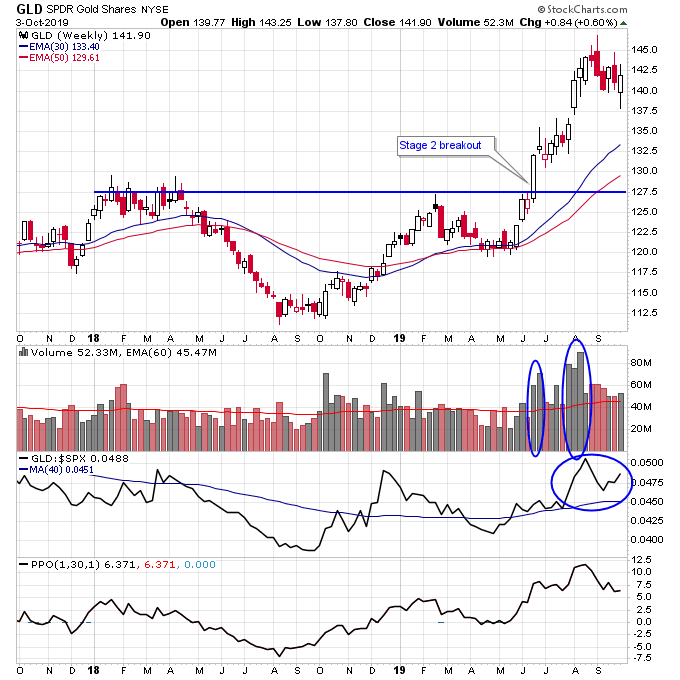
Another important fact is that gold just broke out into a powerful Stage 2 uptrend just a couple months ago, and the likelihood of that reversing this early is not too high. Even the 2016 rally in gold which had a smaller base to work off of would have lasted longer if gold was to fail here.
If you take a look at the chart below of gold on the weekly time scale you can’t even see the head and shoulders pattern.
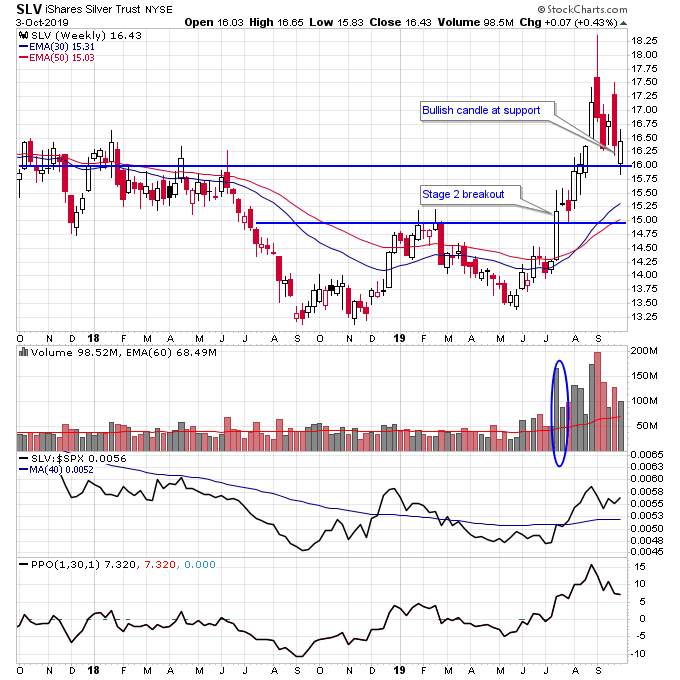
I also like the weekly candle that both gold and silver are putting in this week on above-average volume. Silver is especially important since it is holding its secondary support level at 16 on the chart below. If the metals really were in trouble this support level should fail, but it hasn’t so far. In fact, silver has recently been stronger than gold even during this correction.
While gold and silver still have some room to continue a consolidation after their recent run higher, they also could be setting up for a new leg higher in this Stage 2 uptrend at any time and especially when many have turned short term bearish on the metals.


Comments
Log in or sign up to join the conversation.