
As the title of this morning's missive indicates, there is some good news to report to start the week.
To be sure, the mood on Wall Street has soured lately. Instead of looking ahead to all the good stuff that is likely to occur in the next calendar year and enjoying the traditional year-end rally (aka the Santa Claus rally), traders are focused on the negative. And while things can certainly change in the markets, this has been the worst start to a December since... wait for it... 2008. Argh.
With all the talk about slowing global growth (lest we forget, Germany, Japan, and Switzerland all reported negative GDP results last quarter), slowing earnings, slowing job growth, the trade war, the political risks, peak iPhone, higher rates, the Fed, slower home sales, another big drop in oil, the end of the buy-the-dip era, and of course, when the next recession/crisis will hit the U.S., it is easy to see the market's glass as half-empty here.
However, there is some good news to consider. Valuations have definitely improved.
No, stocks are not cheap. But on a price-to-earnings basis, I'll argue that stocks are no longer extremely overvalued either. And from a macro perspective, this is indeed a good thing.
To be clear, P/E Ratios are not the only way to measure market valuation. And by other measures, such as Price-to-Sales, stocks remain at nosebleed levels. However, the granddaddy of valuation metrics, the Price-to-Earnings ratio, has been getting better.
If you think about what has transpired over the past year or so, this makes sense. The "P" (Price) in the P/E Ratio has gone almost nowhere in 2018. Yet, at the same time, the "E" (Earnings) has soared. As such, it shouldn't be surprising to see the P/E moving down.
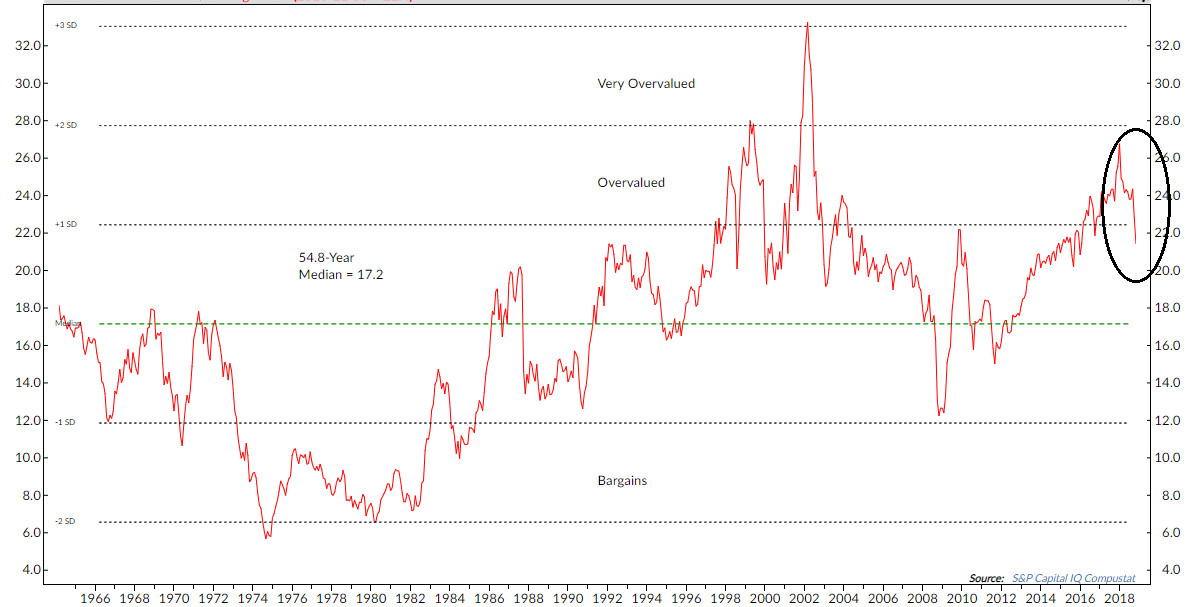
For example, below is one of my favorite versions of the P/E ratio. Instead of using the entire S&P 500, this approach uses the P/E of the median stock. I.E. The midsection of the market. Half above and half below. Take a look at the chart below:
S&P 500 Median P/E Ratio
(Click on image to enlarge)
Source: Ned Davis Research Group
See what I mean? Granted, a median P/E of 21.4 ain't cheap. But it isn't expensive/overvalued either. And this is especially true when looking back over the last 20 years.
As I've opined many times in the past, I believe there are two distinct "eras" on the valuation charts. The first era that spans until the mid-1990s. And the second era since.
If you want to look at the glass as at least half-full here, you can even argue that in the current era, the Median P/E Ratio for the S&P is about average. And given the expectations for earnings to continue to grow, unless the U.S. stumbles into recession or another crisis crops up, there is room for stocks to move higher.
Exhibit B is the P/E Ratio of NDR's Multicap Institutional Stock Index. This looks at a broad swath of the stocks large enough for institutional investors to own.
Multicap Equity Index P/E Ratio
(Click on image to enlarge)
Source: Ned Davis Research Group
Here the P/E ratio has pulled back from the overvalued range and is back to where it stood in 2014-15.
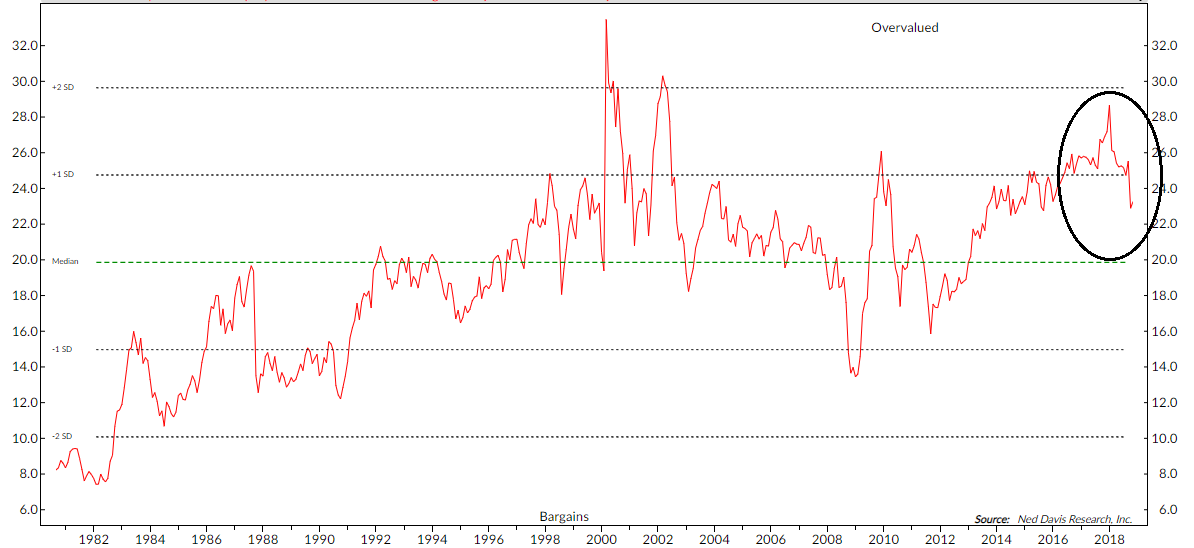
The next chart looks at the P/E Ratio of the Value Line Index, which is arguably one of the broadest indices around.
Value Line Index P/E Ratio
(Click on image to enlarge)

Source: Ned Davis Research Group
On this chart, the "new era" in valuations beginning in 1995 or so, is fairly easy to see. It is also worth noting that the current P/E on the Value Line Index is closing in on where it was at the beginning of 2016. And if you recall, this was when the last "mini" bear ended.
Thus, the bulls can argue that while valuations could certainly continue to improve if the bears stick around a while, stocks are now approaching the valuation levels last seen prior to the most recent leg higher in the secular cycle.
Keeping The Big Picture In Perspective
On that note, I think it is important to keep the big picture in perspective here. From my seat, what we are currently experiencing is a correction that could easily morph into a bear for several more months. It happens.
But we do NOT believe the secular bull that began on March 9, 2009 is at risk here. Barring an external event or a new crisis, we should keep in mind that the economy of the U.S. is still chugging along and likely to continue to do so.
Sure, growth can become uneven and slow down from time to time. And as a discounting mechanism of future expectations, the stock market is always on the lookout for slowing growth. This is likely what we are seeing now.
Yet we should also remember that even if the current corrective phase turns into a bear, the downside will likely fall into the "mini" or "baby" bear category. Remember, NDR's computers tell us that the average decline for these shorter, shallower bear phases is about 23%, and they last about 8 months.
The question at this stage of the game is, where is the bottom? Obviously, we can't know this in advance. However, keep in mind that at some point, values win out. And the good news is valuations are improving.
So, do yourself a favor and stop listening to the permabears who are screaming that the next financial crisis is coming (i.e. loss of 50%). Instead, remember that the best opportunity for gains in the stock market (aka the "easy money") occurs when bear market ends. And since we are already a couple months in, we can look forward to better days ahead.
Thought For The Day: Do not suffer your good nature to say yes when you ought to say no. – George Washington


Comments
Log in or sign up to join the conversation.