

The "G9" (Geometric 9) CIT (Change in Trend) technique I learnt many decades ago from a gentleman, whose name was "G9" on the Crystal Ball forum.
(Click on image to enlarge)
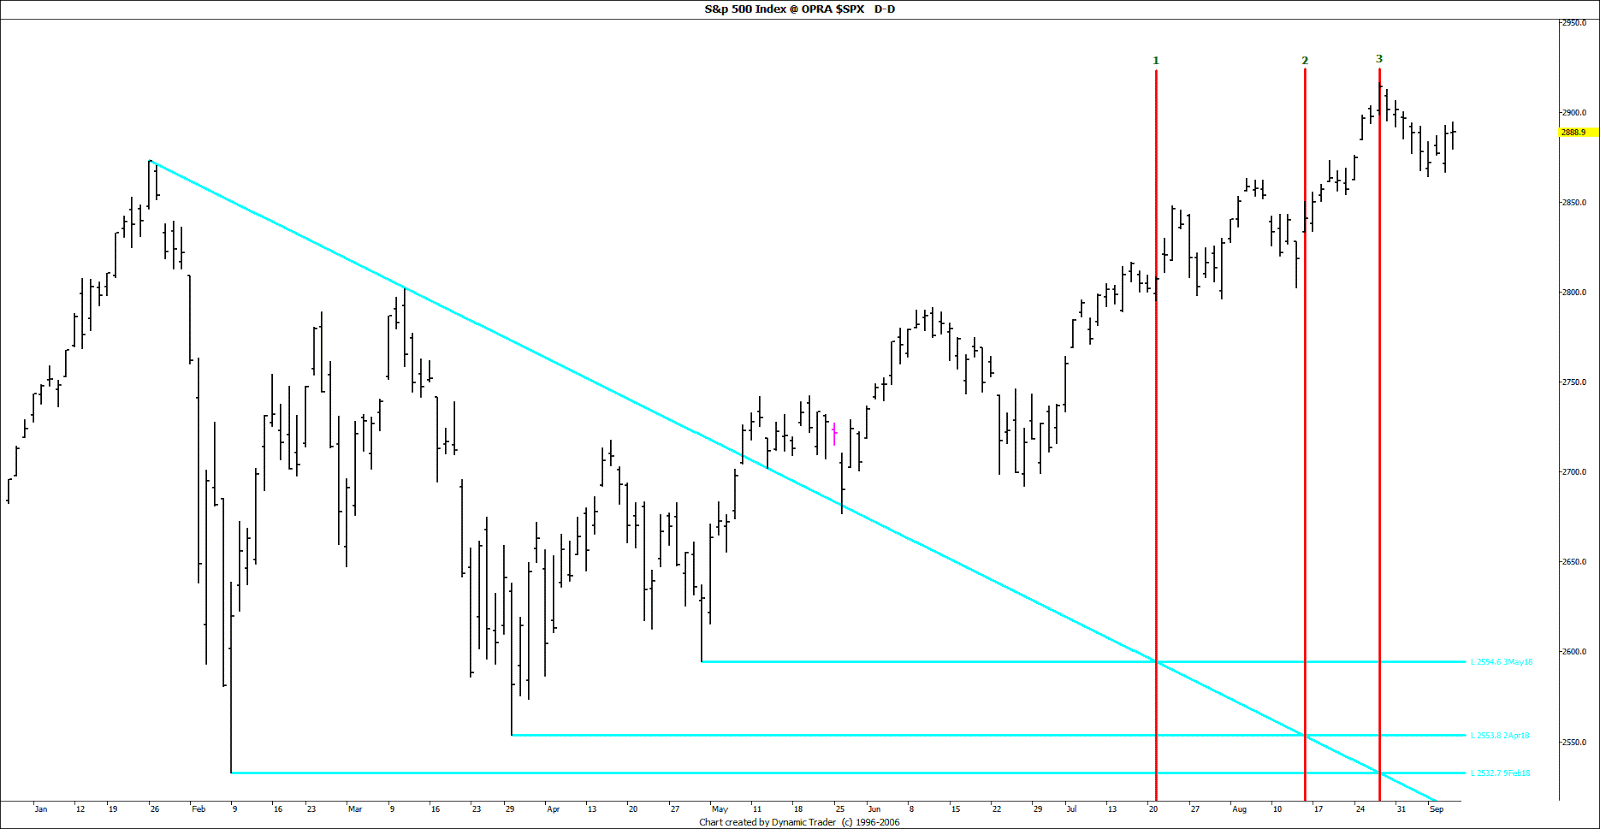
The G9 CIT pinpointed the 7/23/18 Low, 8/15/18 Low and the 8/29/18 swing High.
(Click on image to enlarge)

The 8/29/18 swing High was also part of the Flash Crash 75 week cycle.
The regular 167 TD (Trading Days) Cycle was also mentioned in the past here and is next due 9/13/18 +/-.
(Click on image to enlarge)

167 TDCycle (Pink lines on chart): 9/19/14H -167-5/20/15H -167+1-1/20/16L-167-1-9/14/16L-167+2-5/18/17L-167- 1/16/18 - 167- 9/13/18H+/-2
The regular 93-94 TD Cycle was also a regular cycle and is next due 9/13/18+/-.
93 TD Cycle (red lines on chart): 9/29/15L -93- 2/11/16L -94- 6/27/16L -92- 11/4/16L -95- 8/8/17H -91- 12/14/17L -95- 5/3/18L -94- 9/13/18H+/-2
As fixed cycles can expand and contract it has a +/-2 TD leaway and has been pretty consistent and suggests a 9/13/18 swing High.


Comments
Log in or sign up to join the conversation.