
The Fed’s FOMC minutes from the September meeting suggest the Fed will taper its asset purchases by $15 trillion a month starting in November. At that pace, the current $120 trillion of QE will get zeroed out by July. Currently, there was no timeline to raise interest rates, but over the last few weeks, Fed Funds futures have priced in greater odds of rate hikes in 2022.
For instance, the June 2022 contract now implies a 25% chance of a tightening by June. The odds were near zero in mid-September. The December 2022 contract suggests a 100% chance of a 25bps rate hike and a 50% chance of a second hike by the end of the year.

With more certainty around the Fed’s next steps, the markets are entering a new regime. Is your portfolio ready?
Market Testing Overhead Resistance
Yesterday, the market rallied back to the 100-dma, which now acts as resistance to higher prices. However, while the market tried to climb above it during the trading day, it failed to do so. This morning, futures are pointing higher which will push the index above both the 100-dma and 20-dma. If the rally holds, such will set up an advance to the important 50-dma.
With Friday being options expiration, the volatility seen this week is not surprising. However, the good news is that the overall decline has been very orderly, with no real signs of panic. Such suggests that once the current consolidation period is behind us, we will see a modest advance into year-end.
(Click on image to enlarge)
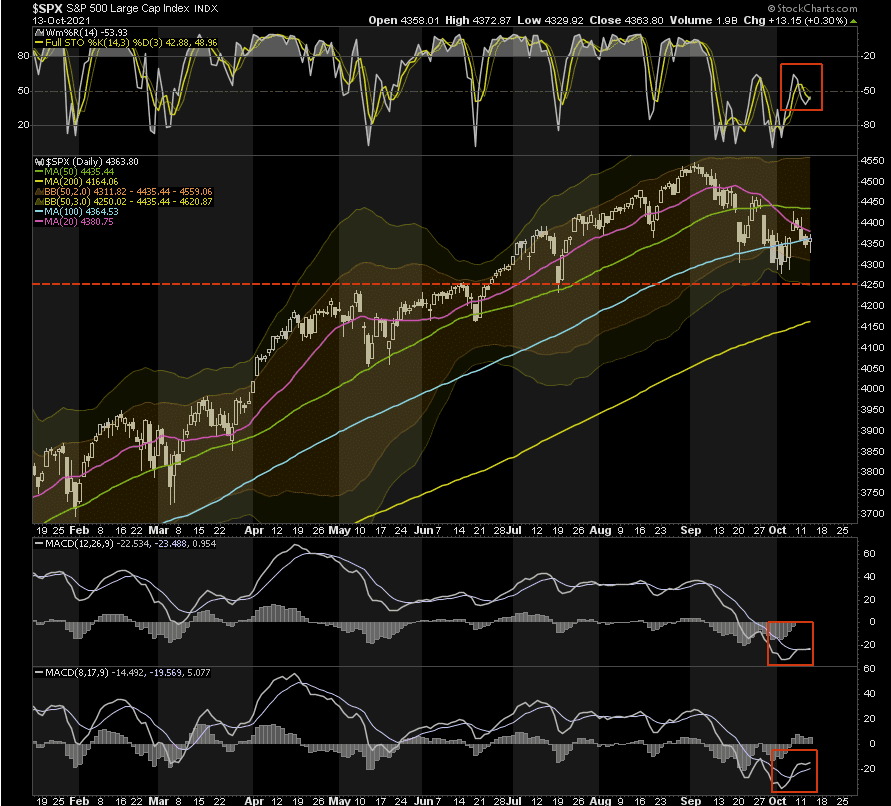
On a longer-term basis, valuations, internal deterioration, reduction in liquidity, and slower economic growth pose serious challenges to the markets in 2022. As such, we continue to suggest a modicum of risk management currently, with a more deliberate approach to protecting capital as the calendar changes.
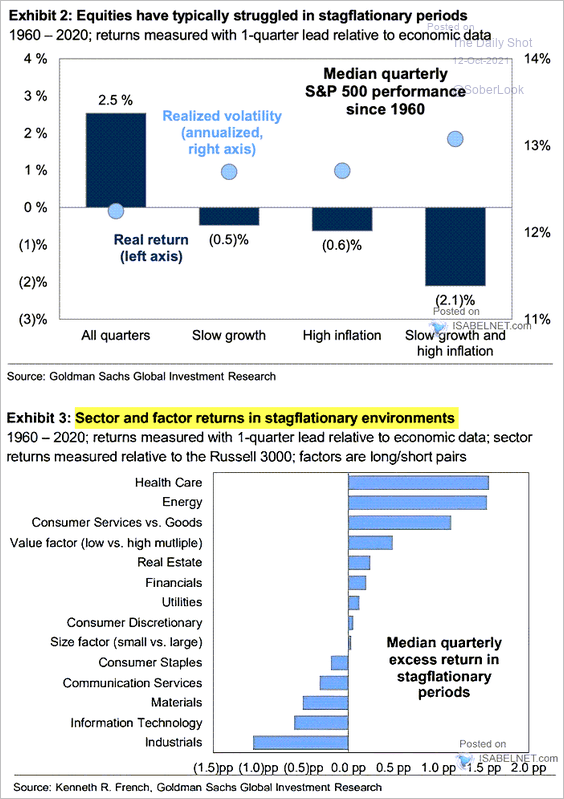
How Do Stocks Perform Under Stagflation?
Goldman Sachs recently published some analysis showing how stocks perform under various inflationary and economic environments. The most notable is the relative performance of stocks in a “slow growth and high inflation” environment. Or, rather what is more commonly known as “stagflation.”
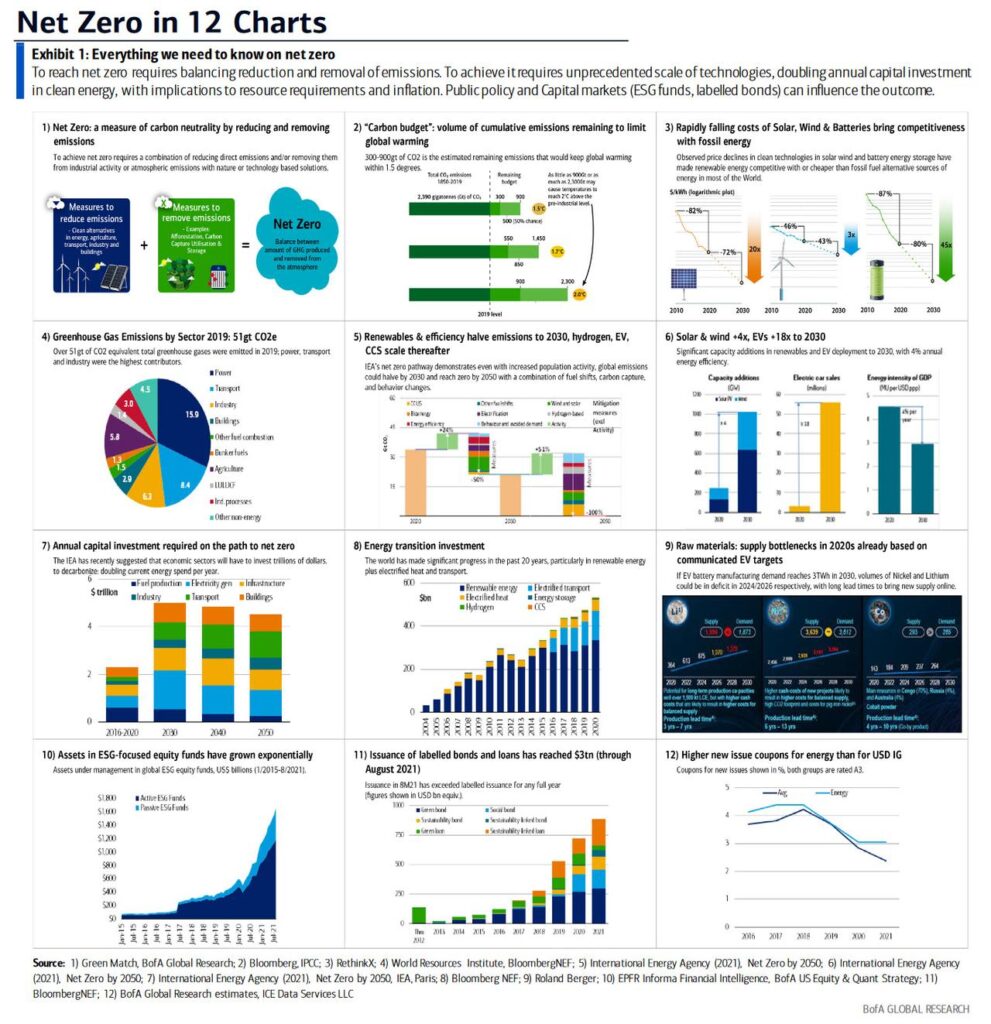
Everything You Need To Know On “Net Zero”
Over the next couple of decades it is expected that global governments will pursue $150 Trillion in spending (mostly derived from debt) to achieve a victory over climate change. While this is great for wealthy, the poor and middle classes will ultimately pay the price through slower economic growth and inflationary pressures. BofA produced the following graphic on where the money will go and, by extension, who will benefit.
(Click on image to enlarge)
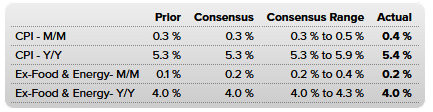
CPI Hotter than Expected
CPI came in slightly higher than expectations. The monthly rate of price increases is 0.4%, 0.1% higher than last month. The year-over-year rate, at 5.4%, is also a tad above expectations. The core monthly and annual rates, excluding food and energy, are in line with consensus.
It is important to note that some inflation resulted from deflation or lower prices this time last year. While “base effects” are rapidly lessening, they are still in play. Per Ben Casselman of the N.Y. Times- “Base effects” — the impact of the drop in prices earlier in the pandemic — are still playing some role in lifting year-over-year inflation. If prices had kept rising at their pre-Covid rate last year, September inflation would have been 5% instead of 5.4%.”
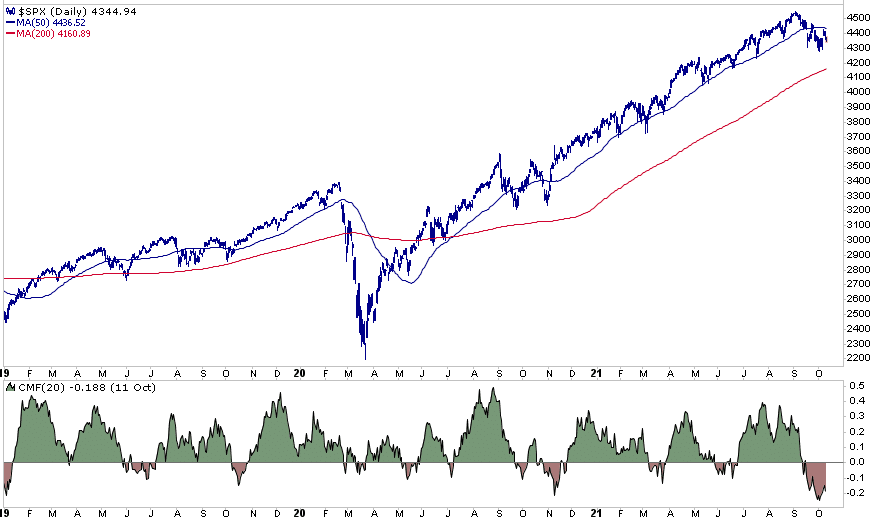
Chaikin is Providing a Warning
The graph below shows the S&P 500 with the Chaikin Money Flow indicator below it. The indicator looks back over 20 days and multiplies the daily volume with the market closing within each day’s trading range. The multiplier is positive when the S&P closes in the upper half of a day’s trading range. Likewise, where the market closes in relation to the high or low is multiplied by the volume. Thus, high volume and a close at the high or low for the day will produce a strong signal.
Technical analysts use the indicator to help determine if institutions are accumulating or distributing. A green reading (above zero) signals accumulation as it is believed institutions tend to buy late in days. Conversely, the strength of the recent string of red days signals early strength gets followed by late-day weakness. Such is a sign of institutional distribution (selling). The Chaikin indicator has not been this profoundly negative since 2018.
(Click on image to enlarge)
“Broadening, Not Transitory”
Atlanta Fed President Bostic went where no Fed member has gone since the pandemic. He stated, “U.S. inflation is broadening, not transitory.” Such appears to be the first time a Fed member voiced concern that higher inflation is no longer transitory. If other Fed members join him in this view, it might speed up the tapering process and bring forward the date of the first rate hike.
Humorously, he started his speech with disdain for the use of “transitory” to describe the recent bout of inflation. To wit: “You’ll notice I brought a prop to the lectern. It’s a jar with the word “transitory” written on it. This has become a swear word to my staff and me over the past few months. Say “transitory,” and you have to put a dollar in the jar.”

Comments
Log in or sign up to join the conversation.