
The current sell-off is one for the history books. CNBC reported that the 6-day trip for the S&P 500 (SPY) from all-time highs to correction territory, defined as a 10% drop from the all-time highs, was the fastest in stock market history. As bad as this plunge looks, the stock market has experienced faster moves between extremes.
I measure extremes by overbought and oversold readings. AT40 (otherwise known as T2108) is my favorite technical indicator for measuring extremes in the stock market. AT40 measures the percentage of stocks trading above their respective 40-day moving averages (DMAs). I consider the stock market overbought when AT40 closes above 70%. I consider the stock market oversold when AT40 closes below 20%. For this latest sell-off, the stock market took 26 trading days to go from the end of the last overbought period to the beginning of this oversold period. Since 1986, the extent of available historical data, the stock market has travelled from an overbought extreme to an oversold extreme just 29 times, including this latest episode (this count excludes times the stock market repeatedly returned to overbought or oversold territory without going to the other extreme). Nine of these periods delivered shorter paths than the current episode.
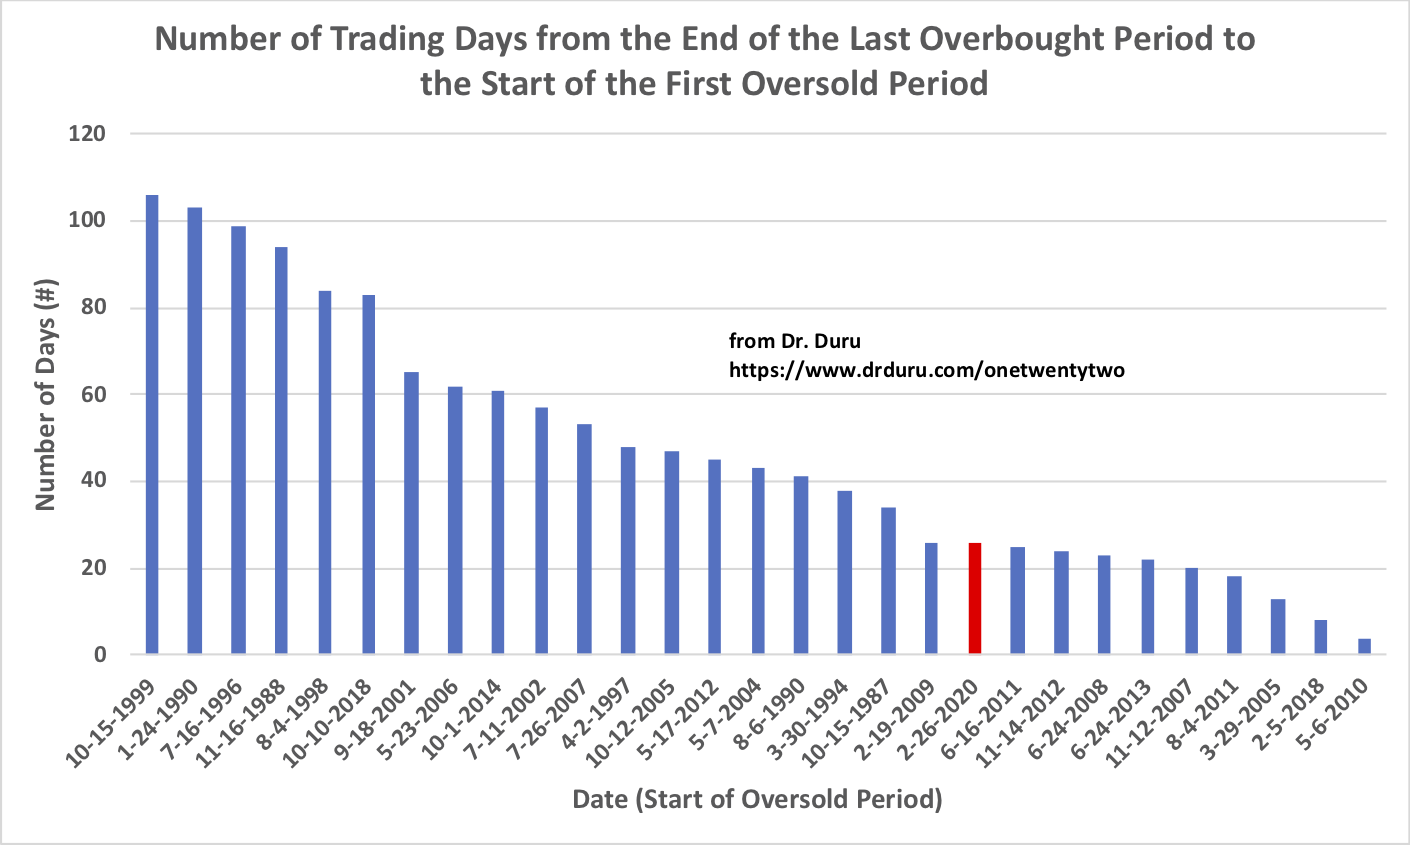
The fastest trip from overbought to oversold was the May, 2010 flash crash. AT40 went from overbought to oversold in just 4 trading days.
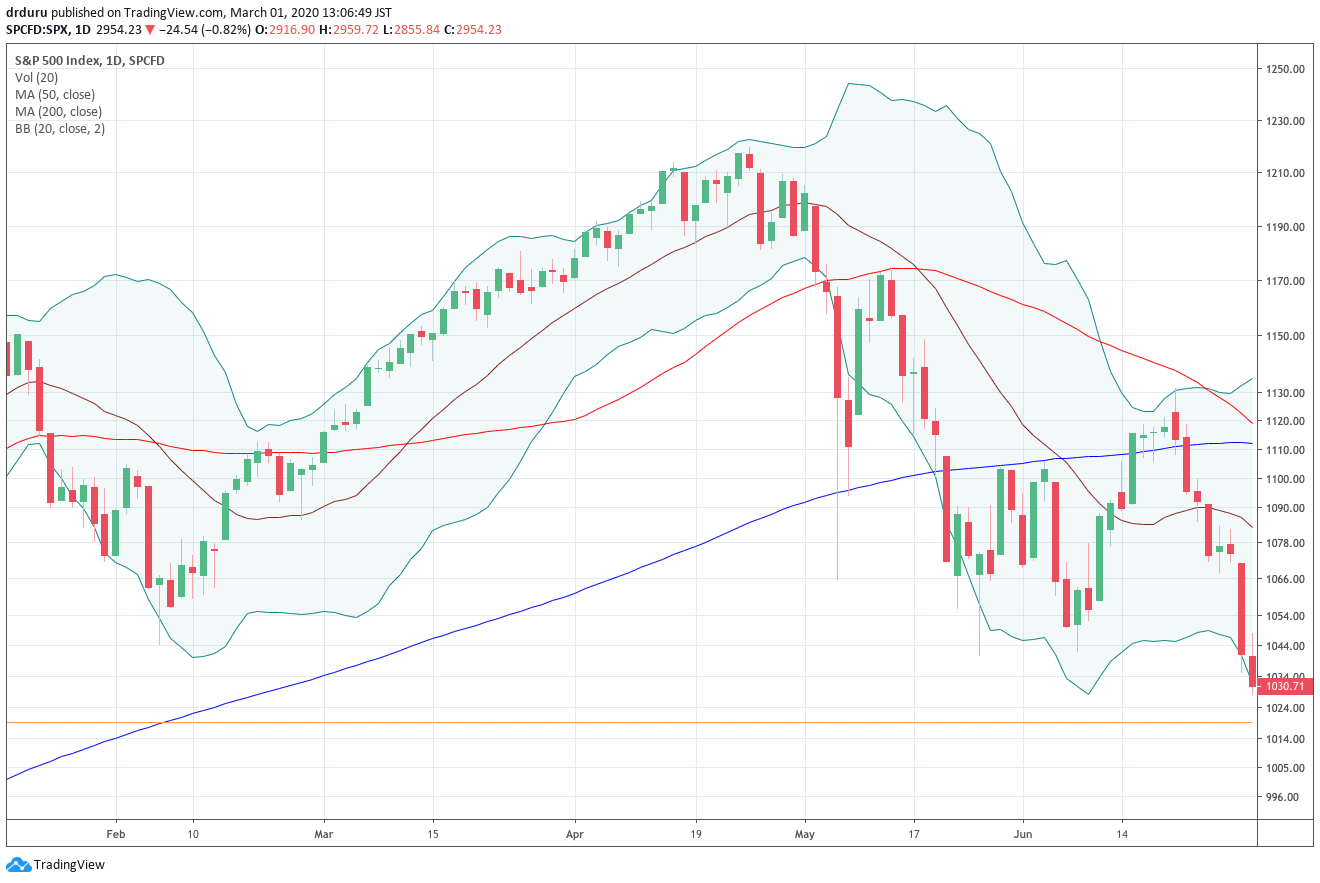
Source: TradingView.com
Just two years ago, the S&P 500 fell from overbought to oversold in 8 trading days as the index experienced a significant cool-down from the hot start of 2018.
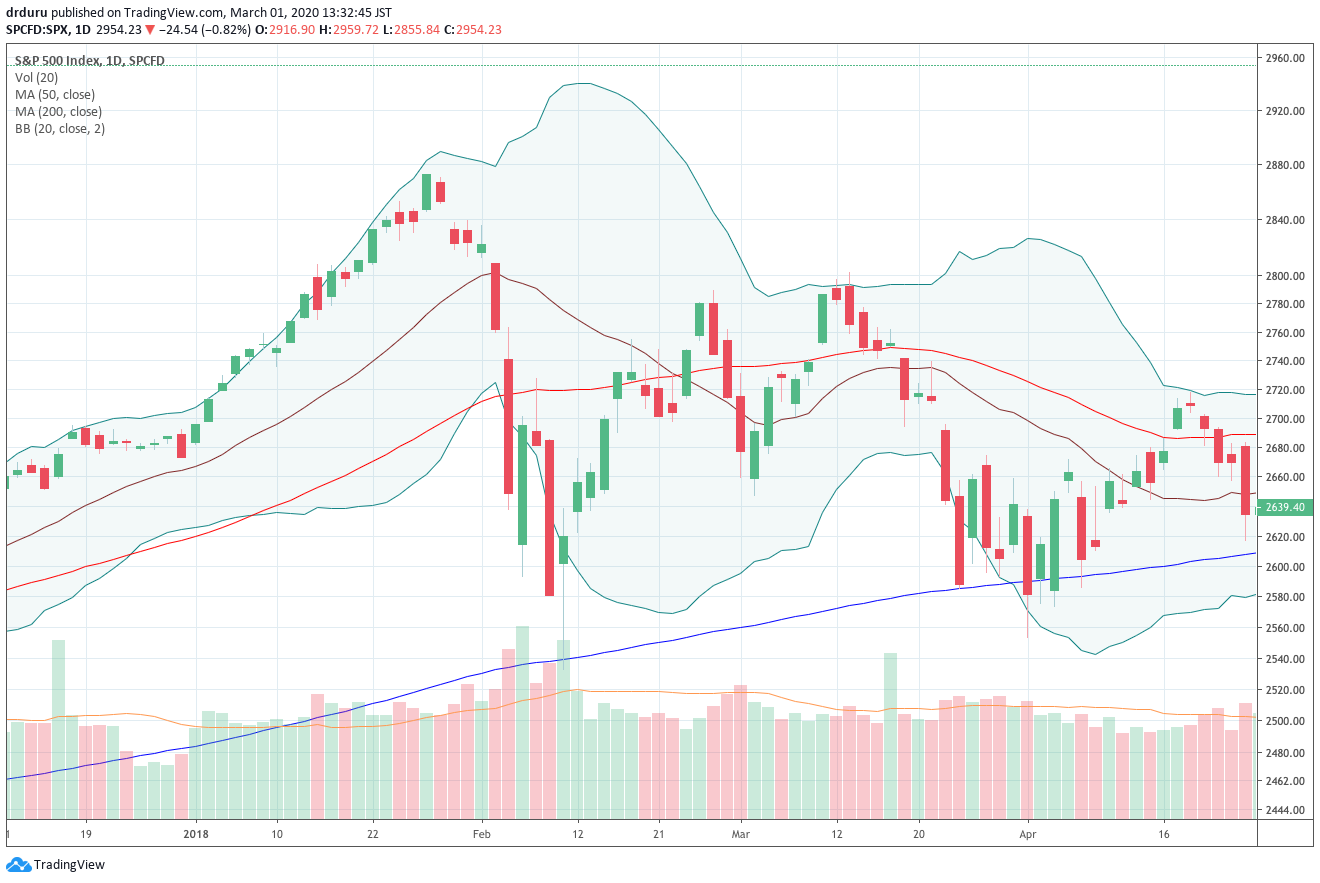
Source: TradingView.com
It took me a week and a half to get bearish on the stock market after AT40 fell from overbought trading conditions. By rule, once AT40 flips oversold, I get bullish on short-term trading conditions. I turned cautiously bullish when AT40 managed to bounce perfectly off the 20% threshold. With AT40 in the single digits, I am unqualified bullish on the stock market for the short-term. In particular, I expect the S&P 500 to deliver a positive gain whenever it finally exists oversold trading conditions.
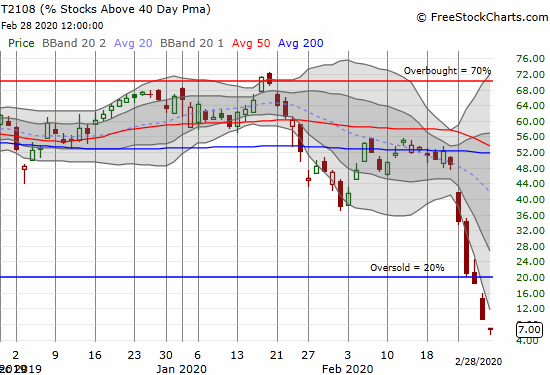
Source: FreeStockCharts
Be careful out there!
Full disclosure: long SSO

Comments
Log in or sign up to join the conversation.