
DAX30 CFD
In our last weekly market outlook we wrote:
"[…]If the bullish momentum continues over the next days and the DAX30 breaks above the April highs around 11,350 points, a re-test of the SMA(200) around 12,000/050 points is a realistic option.[…]"
and the German index really gained massive momentum for the start of the week, driven higher mainly by the EU commission proposal of a 750 Billion-Euro fiscal stimulus package with 500 billion Euro in grants and 250 billion in loans for European Union regions and sectors hit hardest by the coronavirus pandemic.
While this might not come as such a big surprise after Germany and France respectively Merkel and Macron proposed a 500 billion EU recovery fund on May 18, this step can still be considered a first step towards a transfer union.
Still, we remain very cautious in terms of overly aggressive long engagements in the German index, given the more and more unattractive risk-reward ratios after the DAX30 already gained significantly more than 30% from its March lows.
That said, the same seems true for US Equities which might also see a sharper corrective move with US stocks trading at over 143% market cap to US GDP and forward Price-Earnings ratio of higher than 24 which seems way too optimistic given the expected economic downturn in the months to come after the Corona lockdown.
Nevertheless, technically as long as we trade above 10,300 points, the mode stays bullish on D1:
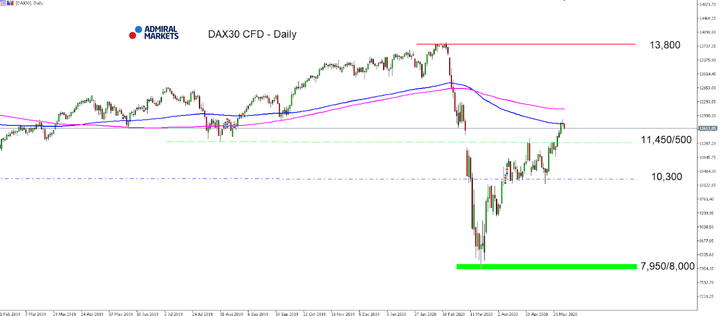
Source: Admiral Markets MT5 with MT5-SE Add-on DAX30 CFD Daily chart (between February 13, 2019, to May 29, 2020). Accessed: May 29, 2020, at 10:00pm GMT - Please note: Past performance is not a reliable indicator of future results, or future performance.
In 2015, the value of the DAX30 CFD increased by 9.56%, in 2016, it increased by 6.87%, in 2017, it increased by 12.51%, in 2018, it fell by 18.26%, in 2019, it increased by 26.44% meaning that after five years, it was up by 34.2%.
US Dollar
While the overall picture in the US dollar hasn't significantly changed over the last week of trading, our take from our last weekly market outlook with seeing the USD under pressure, especially against the Euro after Merkel's and Macron's 500 billion Euro EU recovery fund, played indeed out as expected.
On Wednesday the EU commission proposed a 750 Billion-Euro fiscal stimulus package with 500 billion Euro in grants and 250 billion in loans, pushing the Euro against the US-Dollar back above 1.1000.
While this drove the USD Index Future deeper below 100.00 points again, the technical picture in the USD Index Future stays neutral between 94.00 and 104.00 points.
Nevertheless, we keep the remarks from Fed chairman Powell in mind with saying that in the long run and even in the medium run, you wouldn't want to bet against the American economy, despite an unemployment rate which could rise as high as 25% which can be interpreted as a sign that the Fed will do everything necessary and flood markets with trillions of US dollar to avoid a collapse of the US economy.
In anticipation of this "liquidity boost" could rather sooner than later result in a sustainable drop in 10-year US Treasury yields below 0.60, levelling the path for a deeper push below the 100.00 point mark and meaning further USD weakness against the Euro, but also against the GBP or JPY:
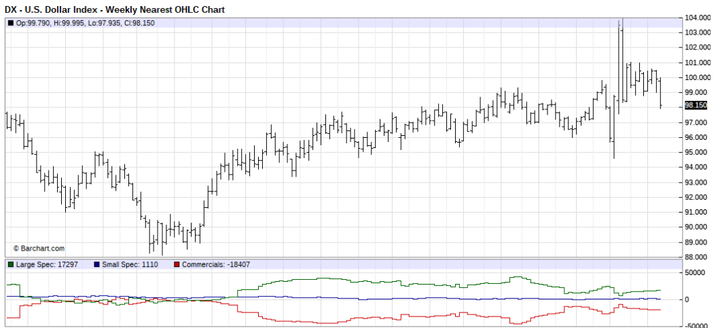
Source: Barchart - U.S Dollar Index - Weekly Nearest OHLC Chart (between July 2017 to May 2020). Accessed: May 29, 2020, at 10:00 PM GMT
Euro
Last week on Wednesday the EU commission helped the Euro to push back above 1.1000 and as we already expected in our last weekly market outlook: the EU commission proposed a 750 Billion-Euro fiscal stimulus package with 500 billion Euro in grants and 250 billion in loans.
While this might not come as such a big surprise after Germany and France's Merkel and Macron proposed a 500 billion EU recovery fund which would offer grants to European Union regions and sectors hit hardest by the coronavirus pandemic on May 18, this step can still be considered a first step towards a transfer union.
While critics will certainly wonder what will happen in the future and in case of an EU member state being in need of money, trading-wise and short-term it is a bullish sign for the Euro.
The sustainable break above 1.1000 levels the path up to 1.1200 and probably even higher in the months to come if we get to see in addition a sustainable drop in 10-year US Treasury yields below 0.60% which would narrow the yield differential between EU and US bonds further, favouring gains in EUR/USD:
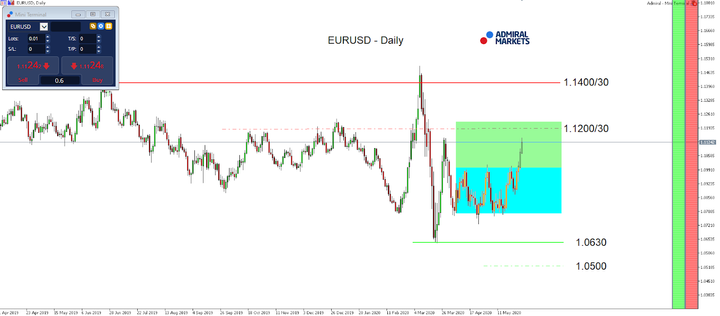
Source: Admiral Markets MT5 with MT5-SE Add-on EUR/USD Daily chart (between April 1, 2019, to May 29, 2020). Accessed: May 29, 2020, at 10:00pm GMT - Please note: Past performance is not a reliable indicator of future results, or future performance.
In 2015, the value of the EUR/USD fell by 10.2%, in 2016, it fell by 3.2%, in 2017, it increased by 13.92%, 2018, it fell by 4.4%, 2019, it fell by 2.2%, meaning that after five years, it was down by 7.3%.
JPY
Again, the overall picture in USD/JPY didn't change over the last week of trading, due to the stable performance in US yields the currency pair kept an eye on the 108.00 mark.
That said, we stay sceptical for USD/JPY and keep our overall bearish outlook on the currency pair.
We keep the remarks from Fed chairman Powell in mind with saying that in the long run and even in the medium run, you wouldn't want to bet against the American economy, despite an unemployment rate which could rise as high as 25% which can be interpreted as a sign that the Fed will do everything necessary and flood markets with trillions of US-Dollar to avoid a collapse of the US economy.
An anticipation of this "liquidity boost" could rather sooner than later result in a sustainable drop in 10-year US Treasury yields below 0.60%, bringing the USD under pressure and thus drive USDJPY lower, too.
That in mind, a test of the region around 105.00 and even a push lower seems a realistic option in the days and weeks to come in USDJPY and as long as the currency pair does not recapture 109.00/50:
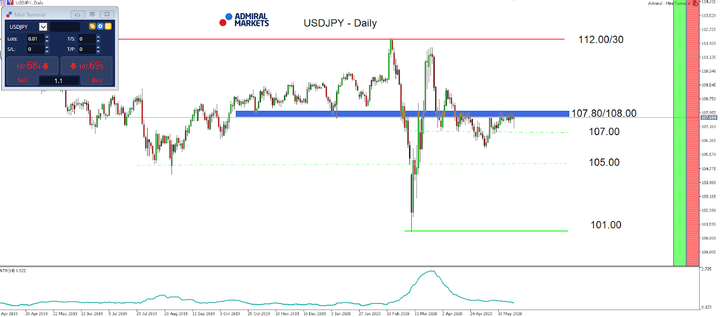
Source: Admiral Markets MT5 with MT5-SE Add-on USD/JPY Daily chart (between April 8, 2019, to May 29, 2020). Accessed: May 29, 2020, at 10:00pm GMT
In 2015, the value of the USD/JPY increased by 0.5%, in 2016, it fell by 2.8%, in 2017, it fell by 3.6%, in 2018, it fell by 2.7%, in 2019, it fell by 0.85%, meaning that after five years, it was down by 9.2%.
Gold
Gold took a hit over the last week of trading, going for a re-test of the region around 1,700 USD.
As already pointed out in our last weekly market outlook, that corrective move could be expected, given the bearish divergence in the RSI(14) on a daily time-frame.
Nevertheless, our take for the yellow metal stays clearly bullish and we expect rather than later a stint to the All Time High around 1,920 USD.
Technically, we consider Gold bullish as long as we trade above 1,660 USD, but also from a fundamental perspective.
While one driver lower over the last days in Gold was certainly the stable performance in 10 year US Treasury yields, we'd not only like to point out the remarks from Fed chairman Powell in mind, saying that in the long run and even in the medium run, you wouldn't want to bet against the American economy, despite an unemployment rate which could rise as high as 25%, indicating that the Fed will do everything necessary and flood markets with trillions of US-Dollar to avoid a collapse of the US economy.
But in addition to that, Gold bulls also keep the last Fed statement in mind where the US central bank clearly pointed out that rate caps are already in place since April 1.
Considering this, a sustainable drop in 10-year US Treasury yields below 0.60% seems only a question of time, leaving us with a bullish expectation:
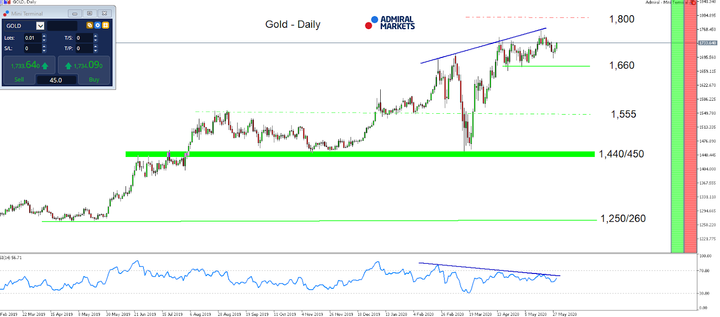
Source: Admiral Markets MT5 with MT5-SE Add-on Gold Daily chart (between February 28, 2019, to May 29, 2020). Accessed: May 29, 2020, at 10:00pm GMT - Please note: Past performance is not a reliable indicator of future results, or future performance.
In 2015, the value of Gold fell by 10.4%, in 2016, it increased by 8.1%, in 2017, it increased by 13.1%, in 2018, it fell by 1.6%, in 2019, it increased by 18.9%, meaning that after five years, it was up by 28%.


Comments
Log in or sign up to join the conversation.