


The economically weighted ISM manufacturing + services indexes continue to be the best timely snapshot of the US economy. With this morning’s update of the services index through July, let’s see what they say. As a quick refresher, I particularly look at the three-month average to smooth out noise, and weigh manufacturing at 25% and services at 75%.
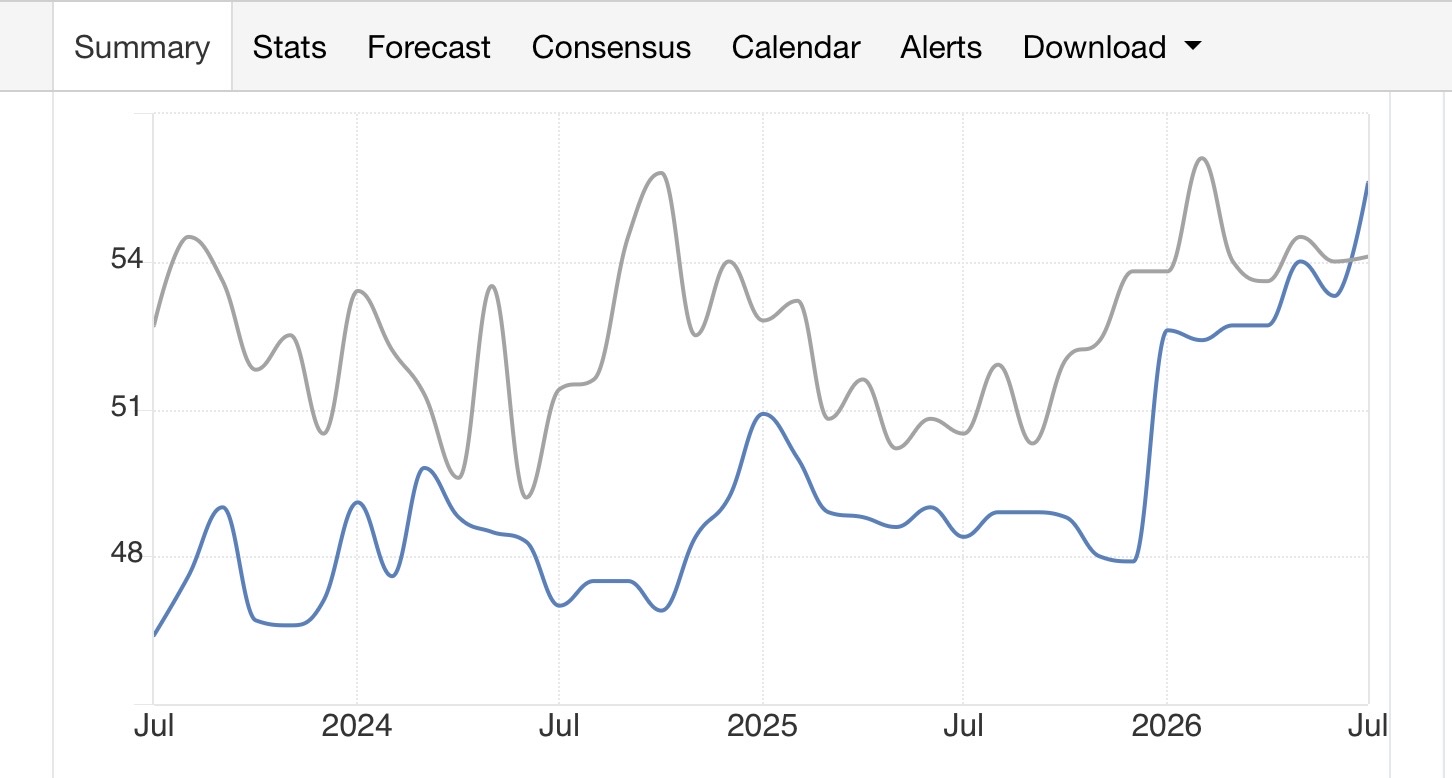
The headline services index, as well as its more leading new orders component, have been consistently positive with the exception of several months last summer. That continued in July. [Note: in all graphs below, the manufacturing component is in blue, with services in gray.]
The headline services index came in at 54.1 [recall that any reading over 50 means expansion]. The three-month average was 54.2. Since the three-month average for manufacturing was 54.3, the economically weighted average was also 54.2:
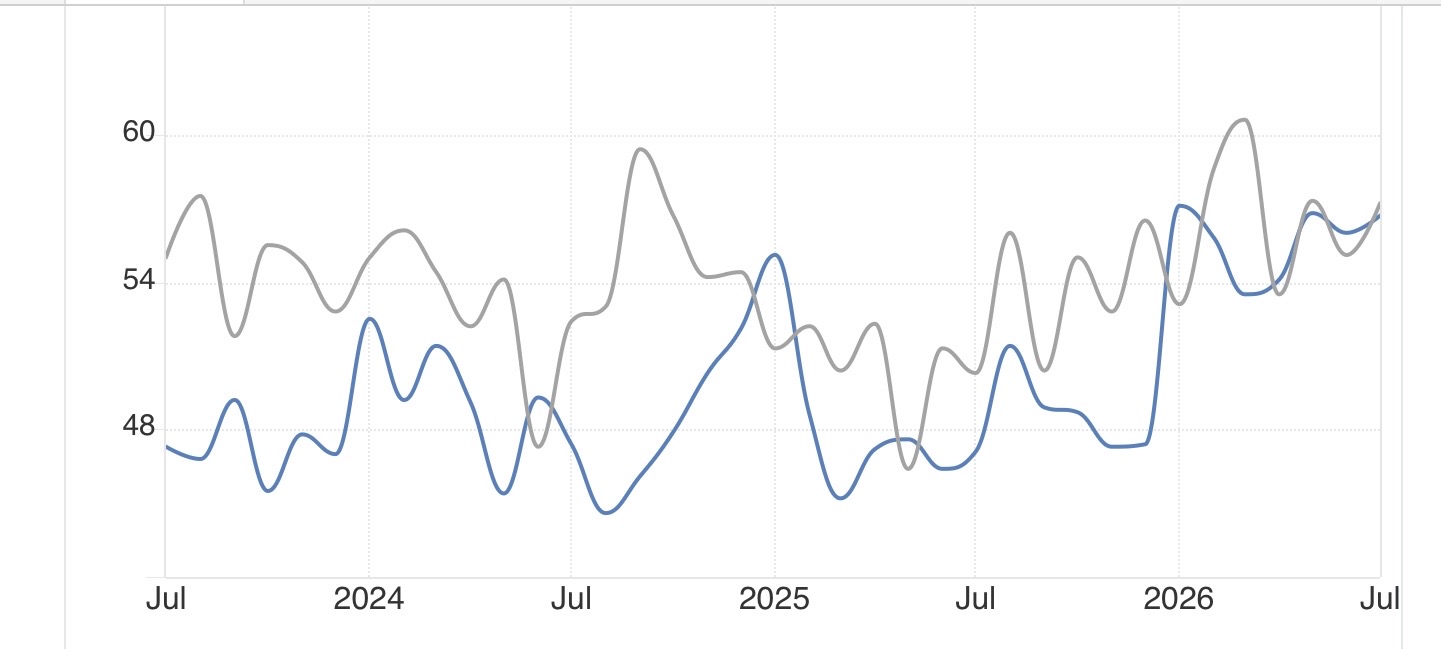
New orders came in at 57.2, among its strongest readings of the past three years. The three-month average was 56.5, which as it happens was the exact same average for manufacturing, meaning - naturally! - that the economically weighted average was also 56.5:
But if the headline and leading new orders components were very positive, the same could not be said of employment, which in the services index slid back into contractionary territory at 47.4. The three-month average was 48.8. The manufacturing employment subindex averaged a very slightly positive 50.4, meaning the economically weighted average was 49.2:
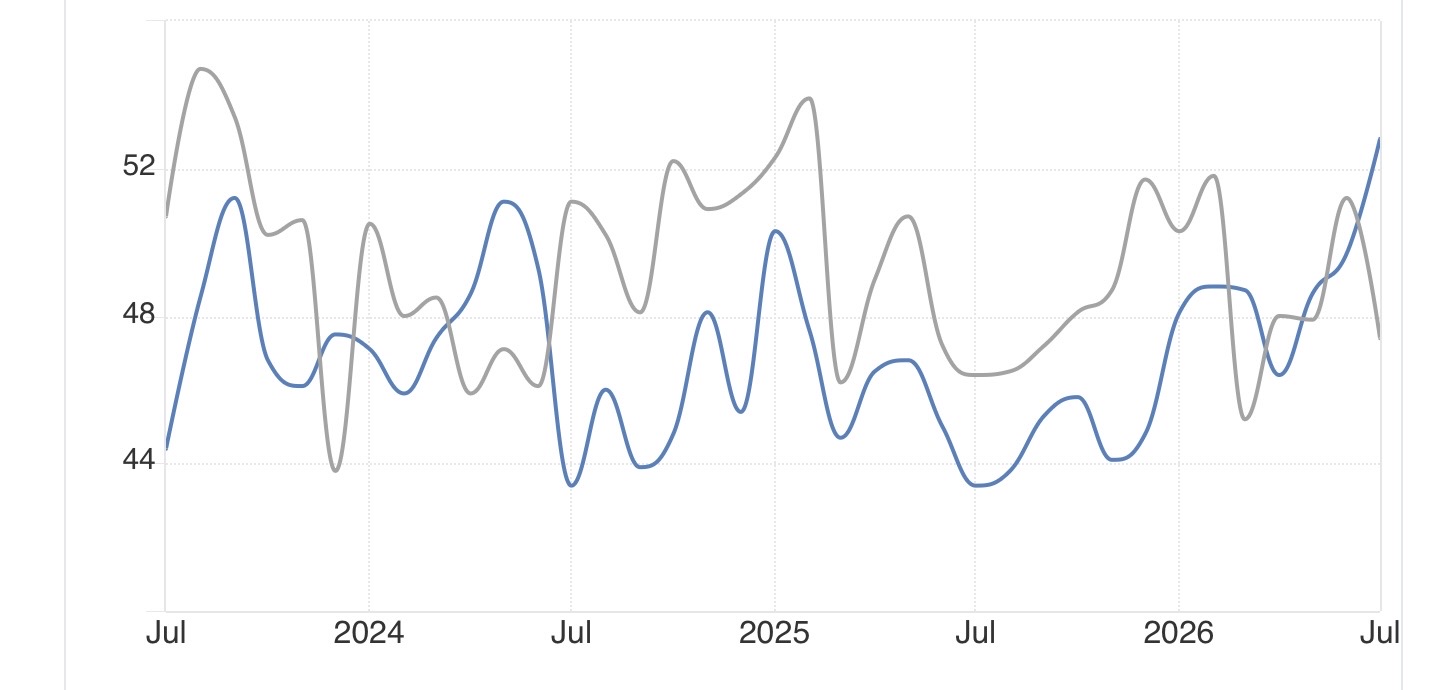
The monthly average of the two employment subindexes has diverged from the official jobs report this year, which has been positive for 5 of 6 months and has shown a gain of over 100,000 jobs in 4 of them. By contrast, the ISM weighted average has only shown expansion in two of them: February and June. Possibly the two metrics will be more aligned once the gold standard for employment, QCEW, is released for Q1 at the end of this month.
Finally, widespread price increases continue to be a problem, with the prices paid index for services coming in at 70.3, with the three-month average at 68.8. The three-month average for manufacturing showed even more widespread pricing pressure at 75.4, meaning the economically weighted average was 71.2:
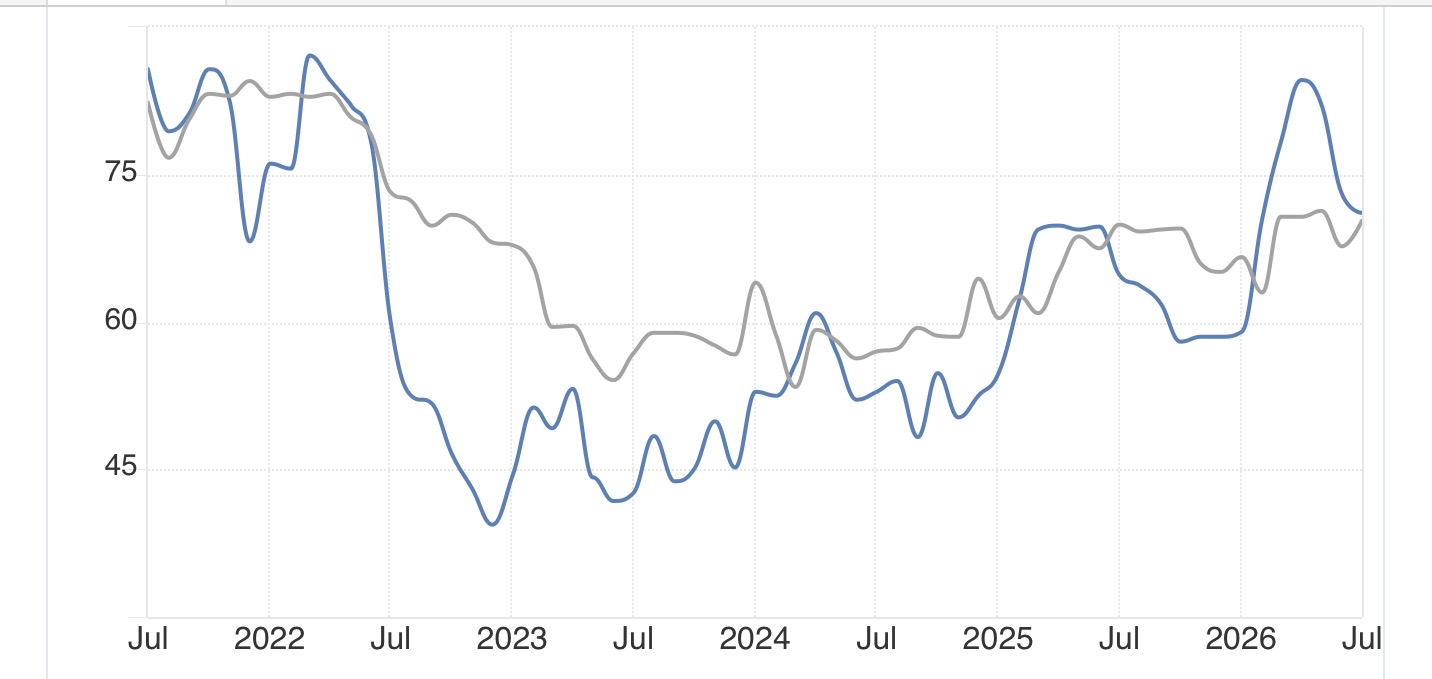
This is a “less worse” result than during spring, but is otherwise the worst since late 2022 (note that unlike the other three graphs, this one shows the last five years for better comparison).
To sum up, as of July, the economically weighted ISM averages show an economy in reasonably strong expansion, but characterized by strong inflationary pressures and weak employment; i.e., a positive but stagflationary environment.



Comments
Log in or sign up to join the conversation.