


Yesterday's breakouts looked promising. Today's price action is raising a few uncomfortable questions.
The U.S. dollar has already slipped back below its recently broken consolidation boundary, while copper buyers have once again failed to overcome an important resistance area. And in copper's case, that failure has brought a potentially bearish A-B-C scenario into focus.
Are we simply watching temporary setbacks, or could these developments signal something more significant?
The answer may depend on a handful of technical levels.
Let's take a closer look.
U.S. Dollar (DX.F) - A Breakout That Didn't Get Very Far
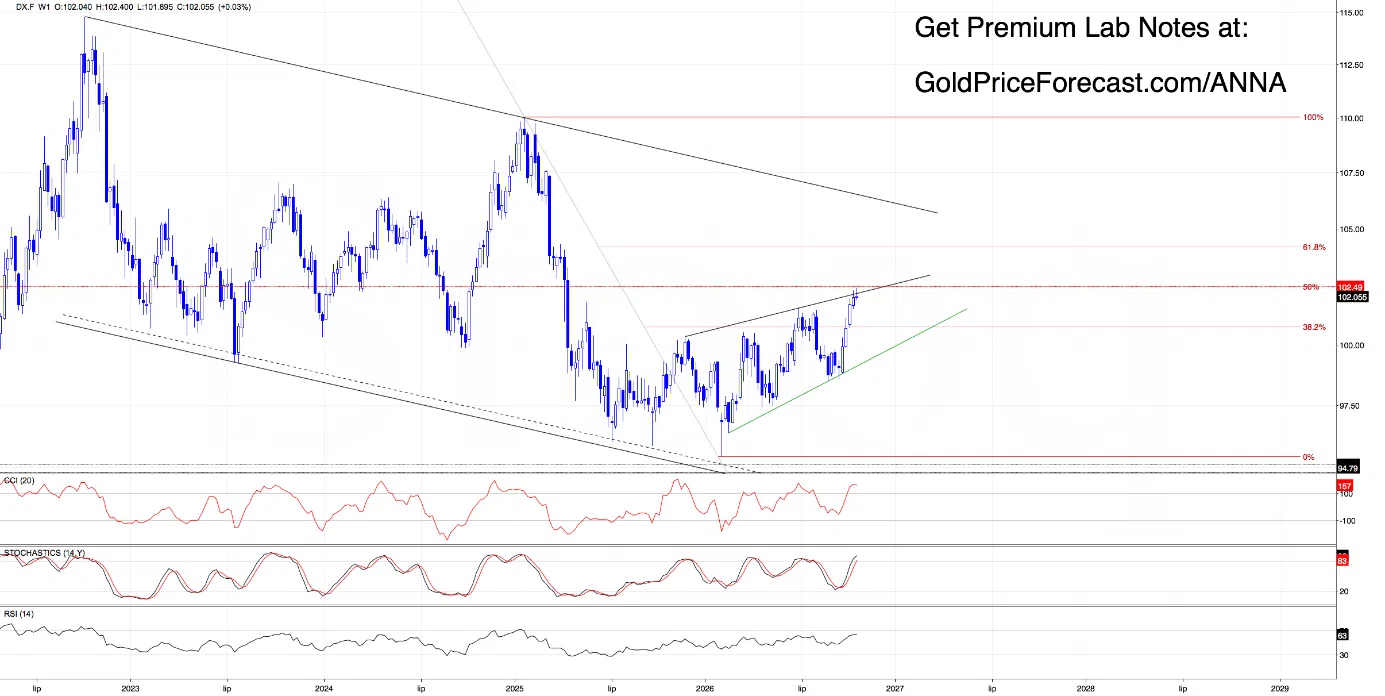
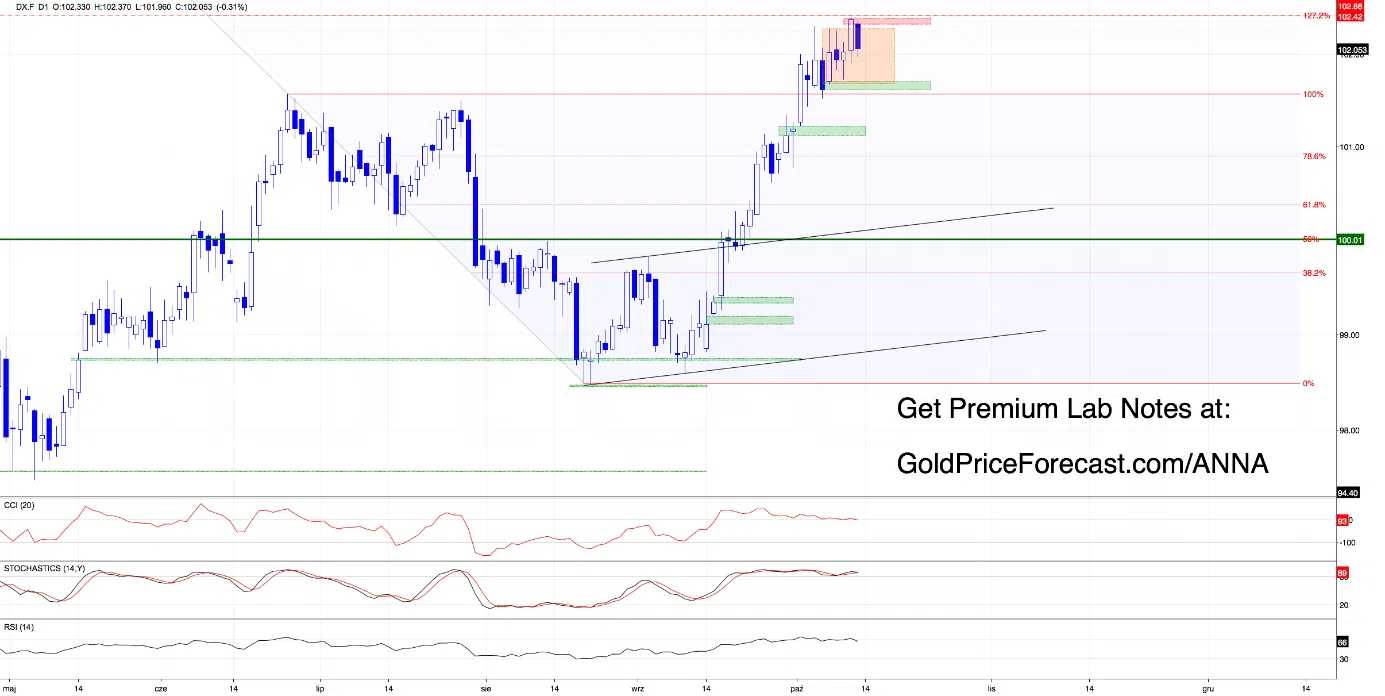
Looking at both the daily and weekly charts, we could almost say the bulls pulled it off.
Almost.
Monday's session delivered a fairly impressive white candle, with the dollar closing above the upper boundary of its orange consolidation between 101.67 and 102.27.
A positive technical development?
Absolutely.
So why didn't the rally continue?
The answer lies just overhead.
The key resistance zone at 102.36-102.49 proved to be a difficult obstacle. And for good reason.
This area brings together the green rising resistance line visible on the weekly chart and the 127.2% Fibonacci extension. Add the negative divergences visible on our indicators, and the bears had a solid technical argument for pushing back.
And push back they did.
Tuesday's Asian session opened with a bearish gap at 102.33-102.37. Sellers quickly seized the opportunity, pushing the dollar below the previously broken upper boundary of its consolidation.
Suddenly, yesterday's promising breakout doesn't look quite so convincing.
What Happens If the Bears Hold Their Ground?
The daily close will be particularly important.
If the dollar finishes today's session below 102.27, it would confirm the invalidation of yesterday's breakout above the consolidation, which would increase the probability of further declines.
The first important downside area combines the consolidation's lower boundary at 101.67 with the bullish gap at 101.60-101.70, created on October 7. However, the broader technical outlook continues to depend on another support zone.
As we've emphasized before, the June and July highs at 101.49-101.57 remain the critical support area shaping our broader outlook. That hasn't changed.
And What Would Put the Bulls Back in Control?
Buyers would need to do more than produce another intraday recovery.
Closing today's bearish gap at 102.33-102.37 would be a positive first step, but the more important achievement would be a daily close above the key resistance zone at 102.36-102.49.
Until that happens, yesterday's breakout remains vulnerable.
Daily Takeaway
Bearish confirmation: a daily close below 102.27 would invalidate yesterday's breakout above the consolidation.
First downside area: the consolidation's lower boundary at 101.67 and the October 7 bullish gap at 101.60-101.70.
Key structural support: 101.49-101.57.
Bullish invalidation of the bearish scenario: closing today's gap and finishing above the 102.36-102.49 resistance zone.
Bottom line: the bulls won yesterday's battle, but they haven't secured the territory. Today's close will tell us whether the breakout was a genuine advance or another failed attempt to overcome resistance.
Copper (HG.F) - The Bulls Hit a Wall. Is an A-B-C Correction Taking Shape?
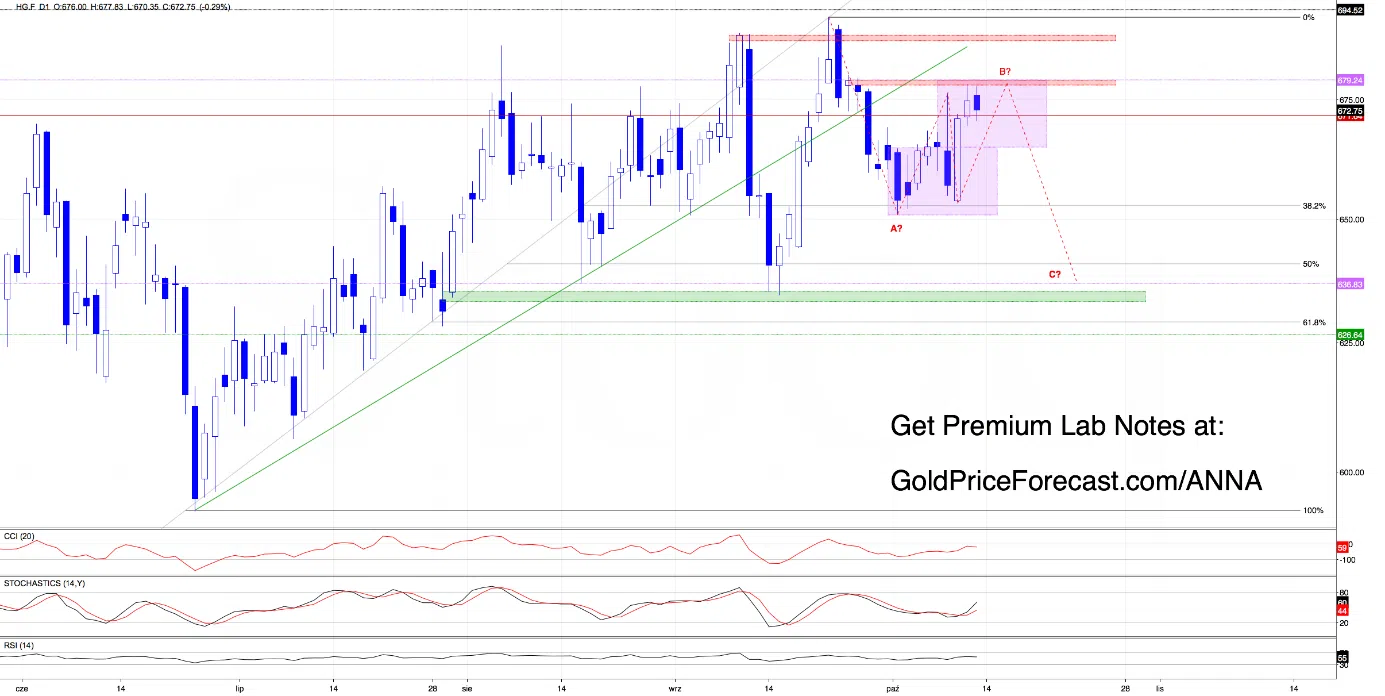
Now, this is where things get particularly interesting.
Copper bulls had a straightforward objective.
After confirming the breakout above the purple consolidation at 650.90-664.60, the minimum upside projection based on the height of that formation pointed toward the 679 area.
A perfectly reasonable technical target, but there was a catch and we warned about it in yesterday's Lab:
"(...) And here's another technical detail worth highlighting.
That target sits right around the bearish gap at 678.05-679 from September 25.
Why does that matter?
Because closing that gap would remove one source of resistance and open the door toward another key obstacle (...)"
We also emphasized:
"(...) In other words, how buyers and sellers behave around these zones could play an important role in copper's next move. (...)"
Well, we didn't have to wait long for the answer.
The Bears Defend Their Territory
After yesterday's Lab was published, copper buyers extended their advance and challenged the bearish gap.
The result?
Sellers successfully defended the area and today's session brought another interesting development.
A higher opening during Asian trading created a bullish gap, giving buyers an additional source of support. Yet even with that advantage, they couldn't push through the overhead resistance.
Once again, sellers refused to give way. That failure was followed by renewed selling pressure, leaving the bullish continuation scenario unfulfilled.
And when a market repeatedly struggles to overcome the same resistance area, it's worth taking a closer look at the developing price structure because there may be something more interesting happening beneath the surface.
Could the Recent Rally Have Been Wave B?
Looking at the potential wave structure visible on the daily chart, we can identify a possible bearish A-B-C zigzag.
Under this interpretation, the recent advance may have represented wave B of a larger corrective formation. And if that hypothesis proves correct?
The market could still be facing wave C - another potentially significant decline.
Assuming wave A and wave C are equal in length, the resulting downside projection would point toward the 637 area.
That's a meaningful potential move but let's be clear.
This is a developing scenario, not a confirmed reversal.
The wave interpretation gives us a possibility worth monitoring. It doesn't mean the market has already committed to that path.
What Would Invalidate the Bearish Scenario?
The key upside level is 679.
A daily close above 679, accompanied by the closure of the previously mentioned bearish gap, would invalidate the proposed bearish development and force us to reassess the scenario.
Until that happens, the current technical picture leaves room for additional downside pressure.
But there's another important question: what could actually trigger a larger decline?
A bearish price formation, such as a double top, could provide additional evidence. Alternatively, a developing consolidation followed by a breakdown below its lower boundary could become the catalyst. Nevertheless, neither signal has been confirmed.
And that's precisely why the 670-679 area deserves particularly close attention right now.
The next reactions around this zone may tell us whether buyers are preparing another successful attack or whether sellers are gaining enough strength to turn the recent setback into something considerably bigger.
Daily Takeaway
Key resistance: the September 25 bearish gap at 678.05-679, which has already stopped another bullish attempt.
Critical observation zone: 670-679.
Potential bearish development: the recent advance may represent wave B of a larger A-B-C corrective structure.
Conditional downside objective: around 637, assuming wave A equals wave C.
Bearish confirmation to watch: a double-top formation or a consolidation breakdown could strengthen the case for another decline.
Bearish scenario invalidation: a daily close above 679 and closure of the bearish gap.
Bottom line: copper's failed attempt to overcome resistance has opened the door to an interesting bearish alternative. But before treating the potential A-B-C pattern as a confirmed reversal, we need price action to support that interpretation.
For now, 670-679 is where the next chapter may begin.
And what about the rest of the metals market?
Gold continues to defend its recent bullish breakout, silver is approaching an important support test, and platinum and palladium are facing renewed selling pressure.



Comments
Log in or sign up to join the conversation.