

One argument for tightening monetary policy is derived from the argument the Fed needs to raise rates to close a “confidence gap”. Instead of psycho-analyzing the markets, I think it better to focus on data.
From “For Yellen, a September Fed surprise could close confidence gap”:
“Market volatility is low, U.S. census data shows income gains have reached the middle class, and workers are clawing back a larger share of national income. For now, at least, no international risk stands out and inflation may even be picking up.
If Fed Chair Janet Yellen wants to prove that policymakers are not being pulled along by investors who for years have second-guessed them, this week may offer a rare moment of calm to do so.
…
“Let’s get on with it already,” said Michael Arone, chief investment strategist at State Street Global Advisors.”
On the other side, we know that manufacturing and industrial production have taken a hit. And as Governor Lael Brainard has noted, weakness abroad is another reason for caution.
As of 11am (EDT) 9/20, futures indicate a 15% chance of a rate hike.
My point has been that one thing we know is linked to the dollar’s value is the interest rate, and the tradables sector is under stress. Manufacturing employment is essentially at 2014M11 levels, while manufacturing output and hours are below.
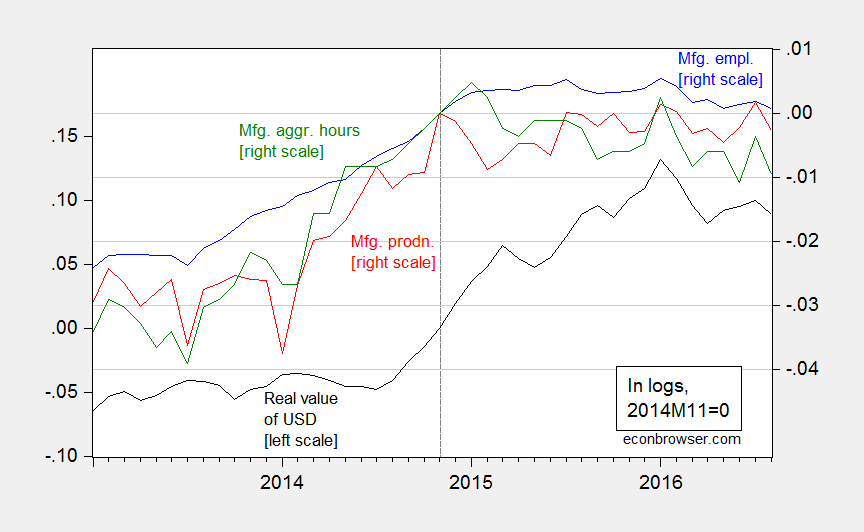
Figure 1: Log real value of USD against broad basket of currencies (black, left scale), log manufacturing employment (blue, right scale), log manufacturing hours (green, right scale), and log manufacturing production (red, right scale), all normalized to 2011M01. Source: Federal Reserve, BLS, all via FRED, and author’s calculations.
While the dollar has dropped in value since the beginning of the year (about 4%), it is still 13.7% higher than it was in mid-2014.
In addition, it could be argued that, while we are likely not in a recession as of July 2016, the indicators are not unambiguously in favor of continued expansion, given the downturn in industrial production.
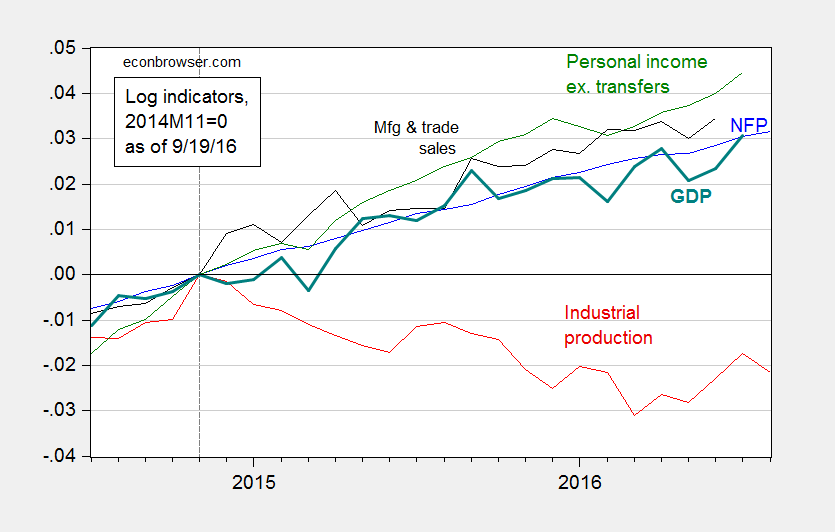
Figure 2: Log nonfarm payroll employment (blue), industrial production (red), personal income excluding transfers, in Ch.2009$ (green), manufacturing and trade sales, in Ch.2009$ (black), and Macroeconomic Advisers monthly GDP series (bold teal), all normalized to 2014M11=0, all as of September 19th. Source: BEA, BLS (August release), Federal Reserve (August release), Macroeconomic Advisers (September 16), and author’s calculations.
Overarching these arguments, it should be remembered that monetary policy has already tightened considerably, taking into account the end unconventional monetary policy.
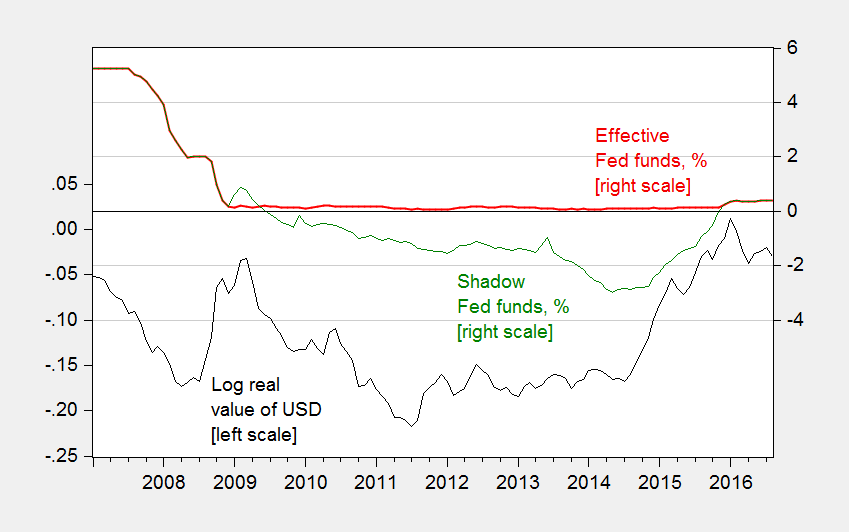
Figure 3: Log real value of USD dollar (black, left scale), effective Fed funds rate, in % (red, right scale), and shadow Fed funds rate, in % (green, right scale). Source: Federal Reserve, Xia-Wu, and author’s calculations.
The short rate has risen nearly 3.4% since mid-2014; in real terms, the rate has risen over 3% (if using 1 year expected CPI inflation rates, as measured by the Survey of Professional Forecasters).



Comments
Log in or sign up to join the conversation.