


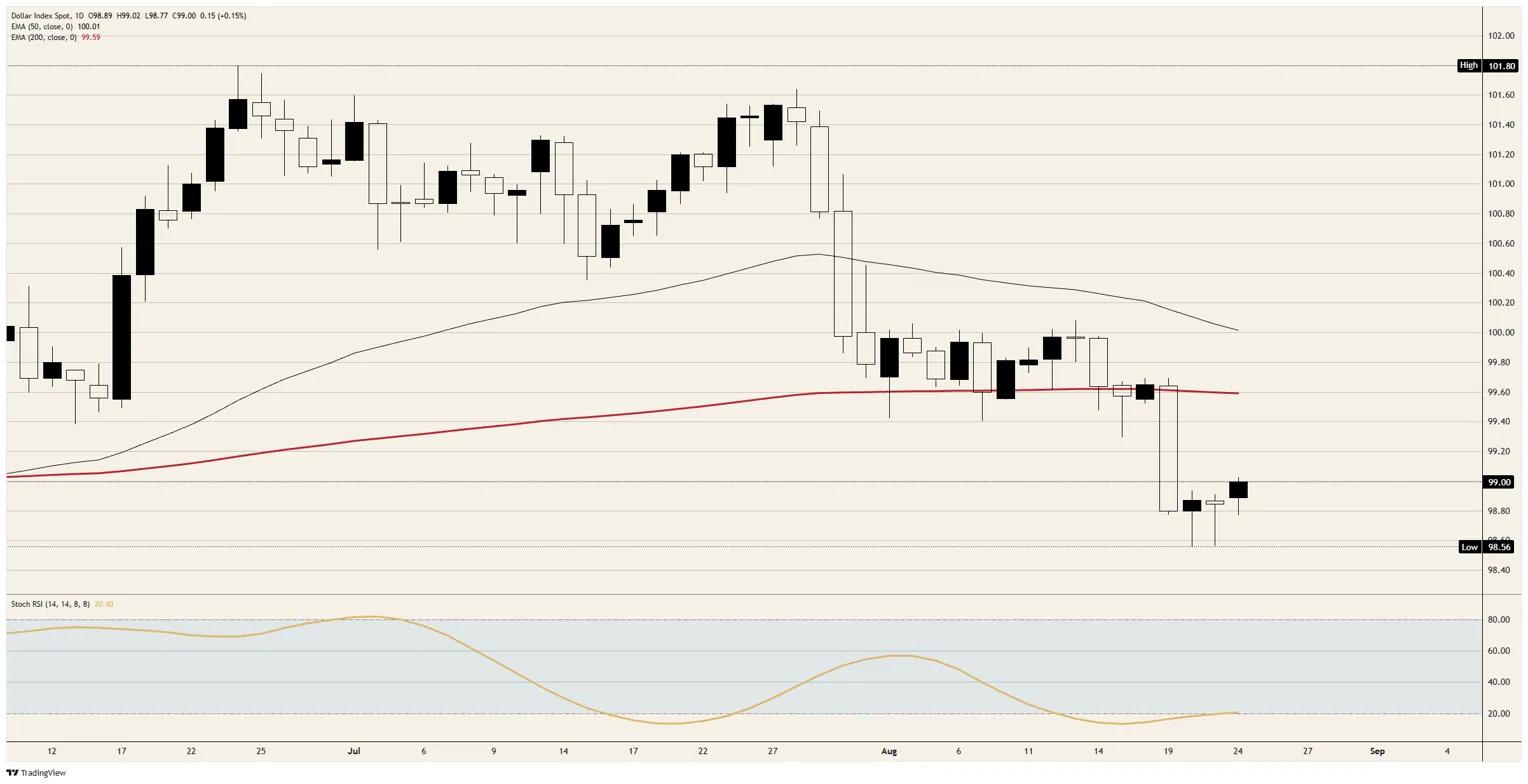
A currency whose central bank has held five times, prices no cut this year and still carries an increase by December should not be sitting at the bottom of its three-month range. The Dollar Index trades near 99.00, up 0.15% and roughly 2.8% beneath its late-June peak, beneath a 200-day Exponential Moving Average (EMA) near 99.50 and a 50-day parked on the 100.00 handle. The rate story stopped paying somewhere in the middle of this month.
Where the Dollars are coming from now
The break that matters is five sessions old, and it did not come from the Federal Reserve. The index lost a 200-day EMA it had held through the summer across August 19 and 20, the sessions that carried the Treasury's move to double the ceiling on its long-end bond buybacks, and it has not traded back above the line since. That was read at the time as a bond story.
Today put a size on the programme. The Treasury General Account (TGA), the government's operating balance at the Federal Reserve, is considered available to fund the purchases, and it stands near 950 billion Dollars against the 550 to 600 billion Dollar working level of the previous administration. Every Dollar that leaves that account arrives in the banking system as reserves, and with the overnight reverse repo facility long since drained, there is nothing left to absorb the flow.
Easing without a vote
Spend a fraction of that balance and the effect on Dollar liquidity compares with a rate cut, delivered without a meeting, a statement or a dissent. The policy rate would sit exactly where it is at 3.50% to 3.75%, while the quantity of Dollars in the system rises. That is a distinction the currency has begun to price, and the front end has not.
The funding side compounds it. Long-dated coupons are bought back and refunded at the front of the curve, so the average maturity of the borrowing shortens and a rising share of the debt reprices with the policy rate. Short bills are the closest thing the Treasury issues to base money, so an issuer converting duration into bills is running an easing operation from the fiscal side of the street.
The tell in today's tape
This session makes the point cleanly. The ten-year yield fell more than three basis points to 4.70%, and the thirty-year shed more than four to near 5.23%, and the Dollar Index gained anyway. Falling US yields alongside a firmer Dollar is not what a rate-differential model produces. It is what happens when the yield falls because the issuer is buying, which tells you about the price of the bond rather than the appetite for the currency.
The demand side gets a threat too
At 18:00 GMT, the Treasury Secretary unveils what the administration has trailed as the largest financial offensive ever mounted against Iran, with the warning aimed squarely at the countries still lifting Iranian barrels. The largest of those is China. Tehran's national security chief has already said that any state joining the measures commits an act of war.
Secondary sanctions work by making the Dollar payment system dangerous to use, which is a serviceable tactic and a poor advertisement. Foreign holdings of Treasuries fell in June with the United Kingdom, China and Japan each trimming, and the message to those same accounts this week is that they should hold more of the paper and expect to be policed over their energy purchases.
This week's tests
Wednesday at 12:30 GMT carries the July Personal Consumption Expenditures (PCE) price index, the core measure seen at 0.2% MoM from 0.1% with the annual rate holding at 3.3%, alongside preliminary second-quarter Gross Domestic Product (GDP) figures the consensus expects to be revised by nothing at all. Personal spending is seen at 0.2% from 0.3%.
Friday carries the currency's real risk. The Fed Chair speaks at 14:00 GMT from the annual symposium, and the Bureau of Labor Statistics (BLS) publishes the preliminary benchmark revision to the payroll survey at the same time. A hawkish Chair reading out a labour-market history that has just been cut is the awkward combination, and the 2024 preliminary revision took 818K jobs off the count.
Levels
Resistance: 99.00 is the line this bounce has stalled against, with the 200-day EMA near 99.50 above it and the 50-day sitting on the 100.00 handle. A daily close through the EMA band is the only thing that reopens 100.50.
Support: The session low sits near 98.75, and the 98.50 area carried the low of the move, beneath which this window offers no reference at all. The daily Stochastic Relative Strength Index (Stoch RSI) near 20 is oversold and turning, which explains the bounce and not its stopping point.
Bias: Bearish while the 200-day EMA near 99.50 caps. Objectives the 98.50 area, then a look beneath it. Invalidation on a daily close above 99.50.
DXY daily chart



Comments
Log in or sign up to join the conversation.