

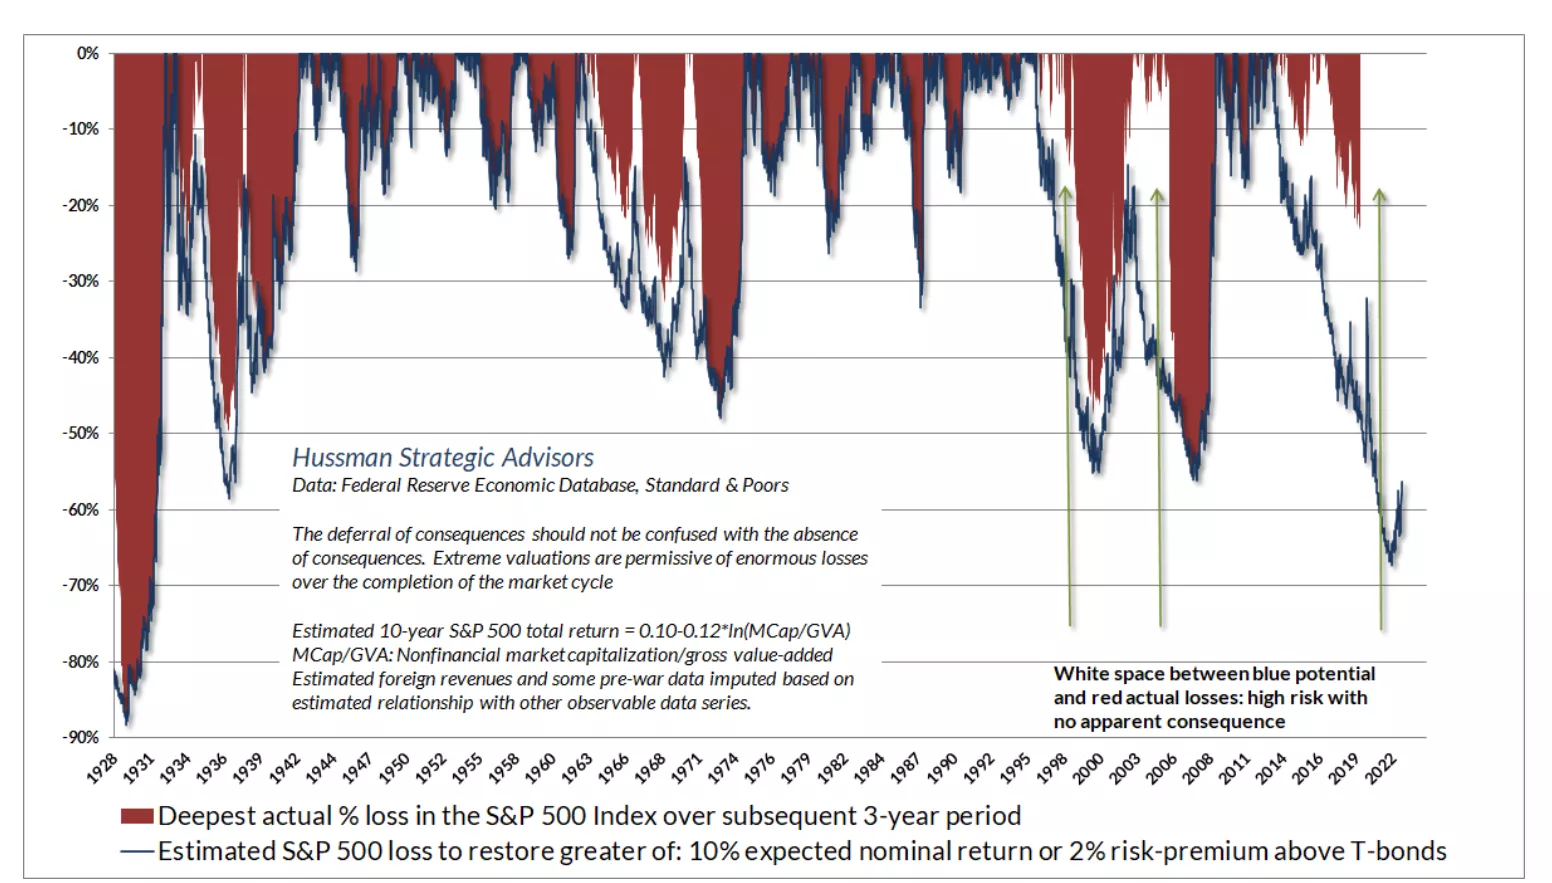
The graph below offers some information on the market loss needed to restore even common historical value norms.
The blue line in the following figure, which is based on valuation (Hussman's MarketCap/GVA), represents the amount of market loss required to reduce predicted S&P 500 returns to the higher of either a) the 10% long-term historical average or b) a 2% risk premium above Treasury bond yields.
Since we don't yet know the worst loss for more recent periods, the shading in the red region stops 30 months ago and represents the S&P 500's greatest actual loss for the ensuing 30-month period.
Take note that the market loss from 2000 to 2002 only partially restored historical valuation norms.
Of course, between its bottom in October 2002 and its low in March 2009, the S&P 500 also recorded a negative total return.
Investors can resist overvaluation for a while by engaging in speculative activity, but ultimately they are unable to conceal.
The reason why prospective market losses could be so great is precisely that extended period of unrestrained speculation.


Comments
Log in or sign up to join the conversation.