

Summary
Looks like the crypto/Bitcoin swoon continues . . . risk-off environment? That is concerning because crypto decline have preceded the larger equity declines in recent times.
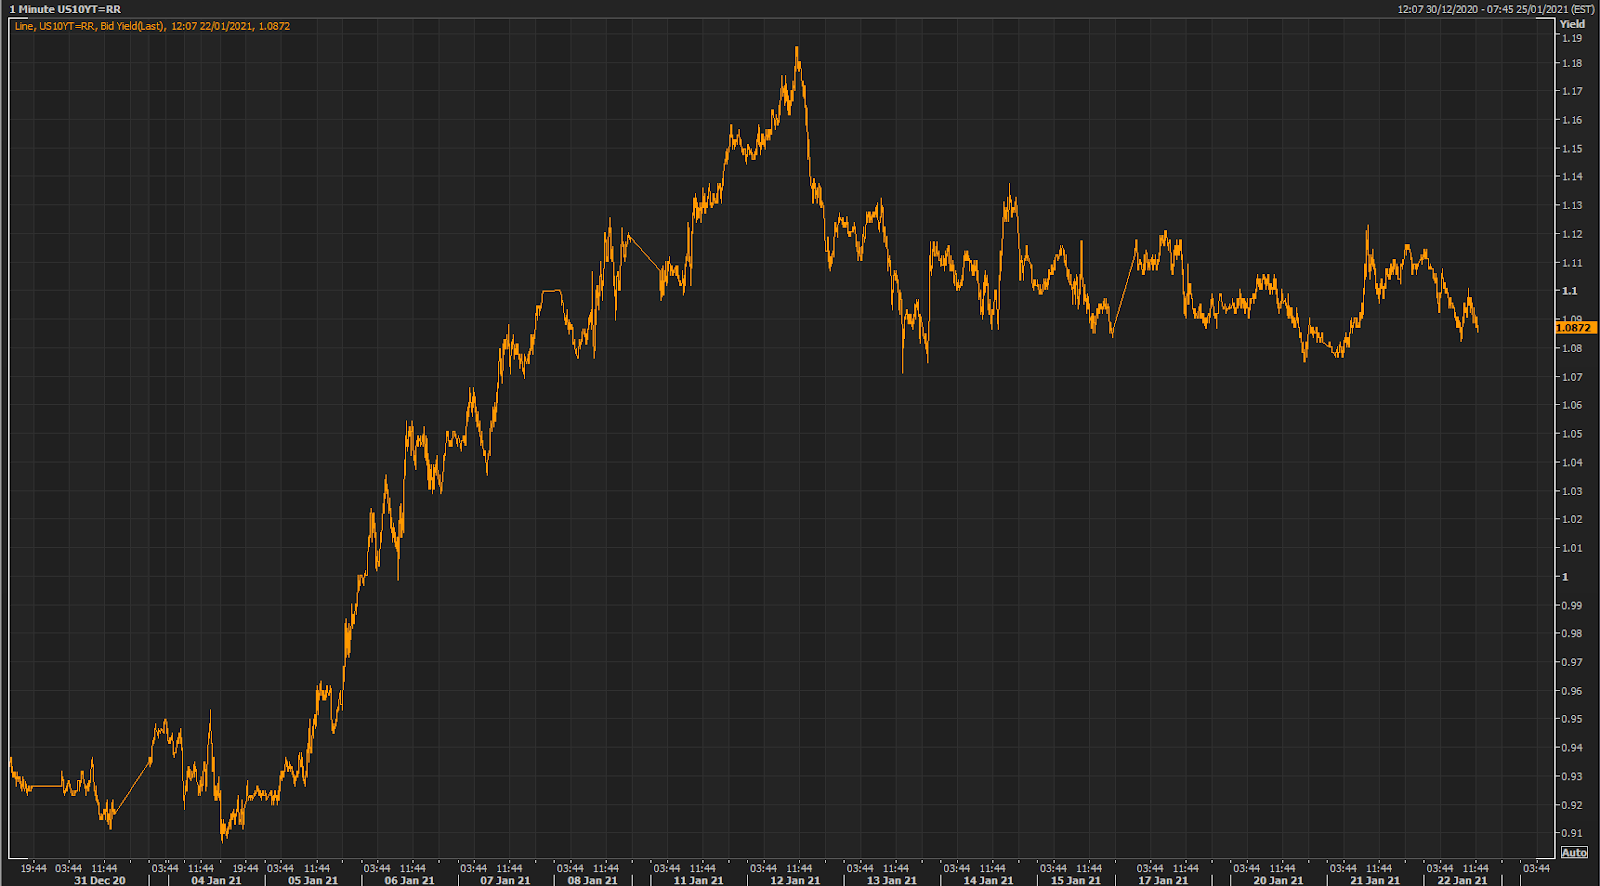
Yield moves still performing like a mid-way consolidation, but no idea when it start breaking below the 1.0750 support. That could come Monday in Asia, maybe.
But equity futures are falling, so TimKi was wondering whether we should pencil in lower downside targets, lower than we have previously discussed and illustrated.
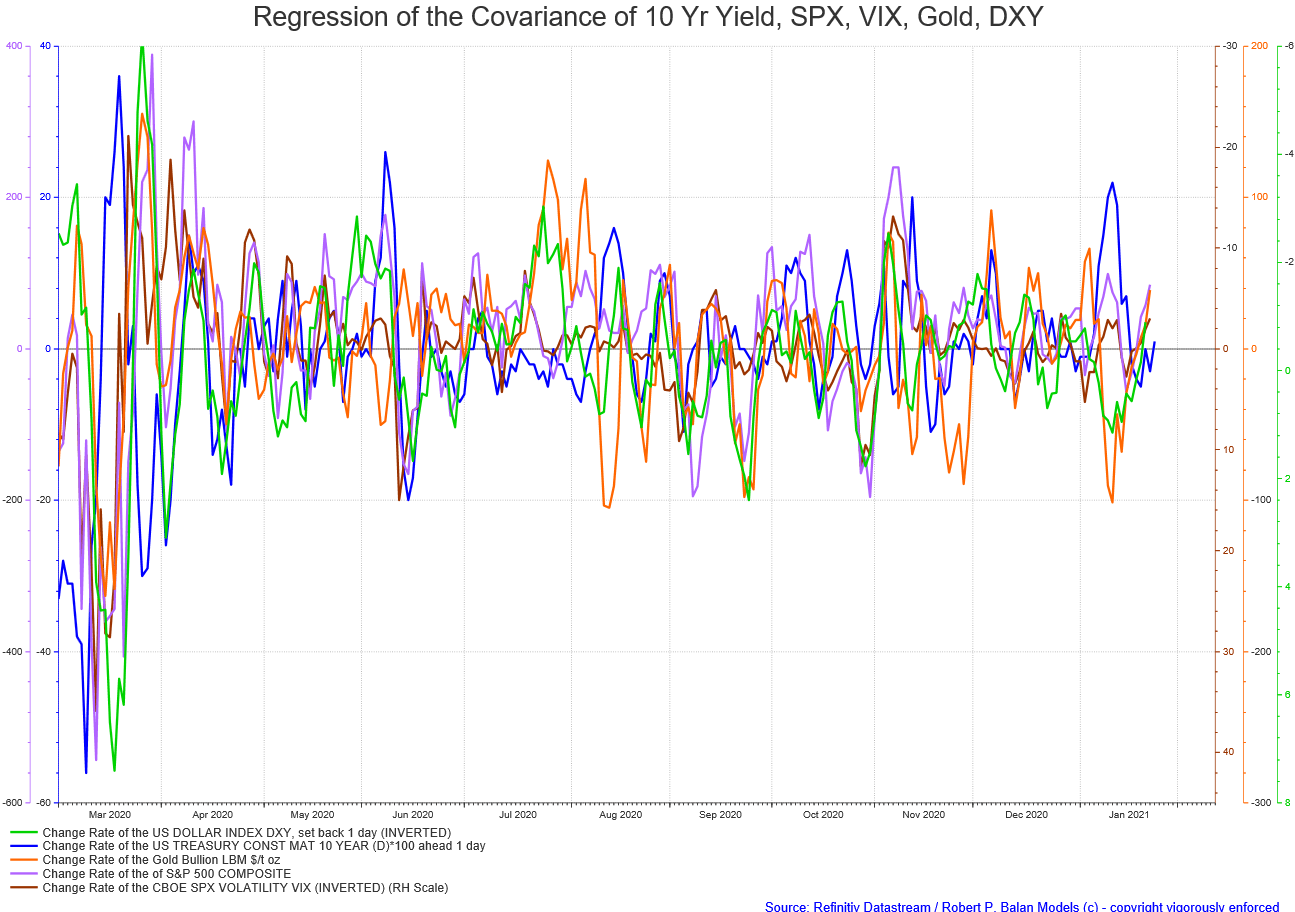
Gold and equities have gone back into positive covariance. And the Dollar should rise, as should be the case in risk-off environment, which seems to be taking hold, for now.
The energy sector is starting to meet headwinds, as we explained yesterday. "If you are long gasoline or crude oil -- offload those asap -- the crude oil sector is about to keel over. RPB gasoline and oil inventory models are suggesting that current oil inventory drawdowns are coming to an end. "
------------------------------------------------------------------------------------
---------------------------------------------------------------------------------------- Here are the current status of the PAM flagship Swing Fund, which includes open and closed trades.
During the twelve months of 2020, PAM delivered phenomenal real-dollar Hedge Fund trading performance, the best at Seeking Alpha:
PAM's flagship Swing Portfolio, year-to-date (December 31, 2020) delivered $100, 181,522.77 net profit on $11,172,813 margin capital.
Year-to-date performance: 754.20%, on 888-98 win-loss trades.
December 2020 spreadsheet here:
Year to date 2020 spreadsheet here.
--------------------------------------------------------------------------------------
JANUARY 22, 2020
GOOD AFTERNOON EUROPE / GOOD EVENING WEST COAST
robert.p.balanModeratorLeaderOwnerJan 22, 2021 11:55 AM
Looks like the crypto swoon continues . . . risk-off environment? That is concerning because crypto declines have preceded some of the larger equity declines in recent times.
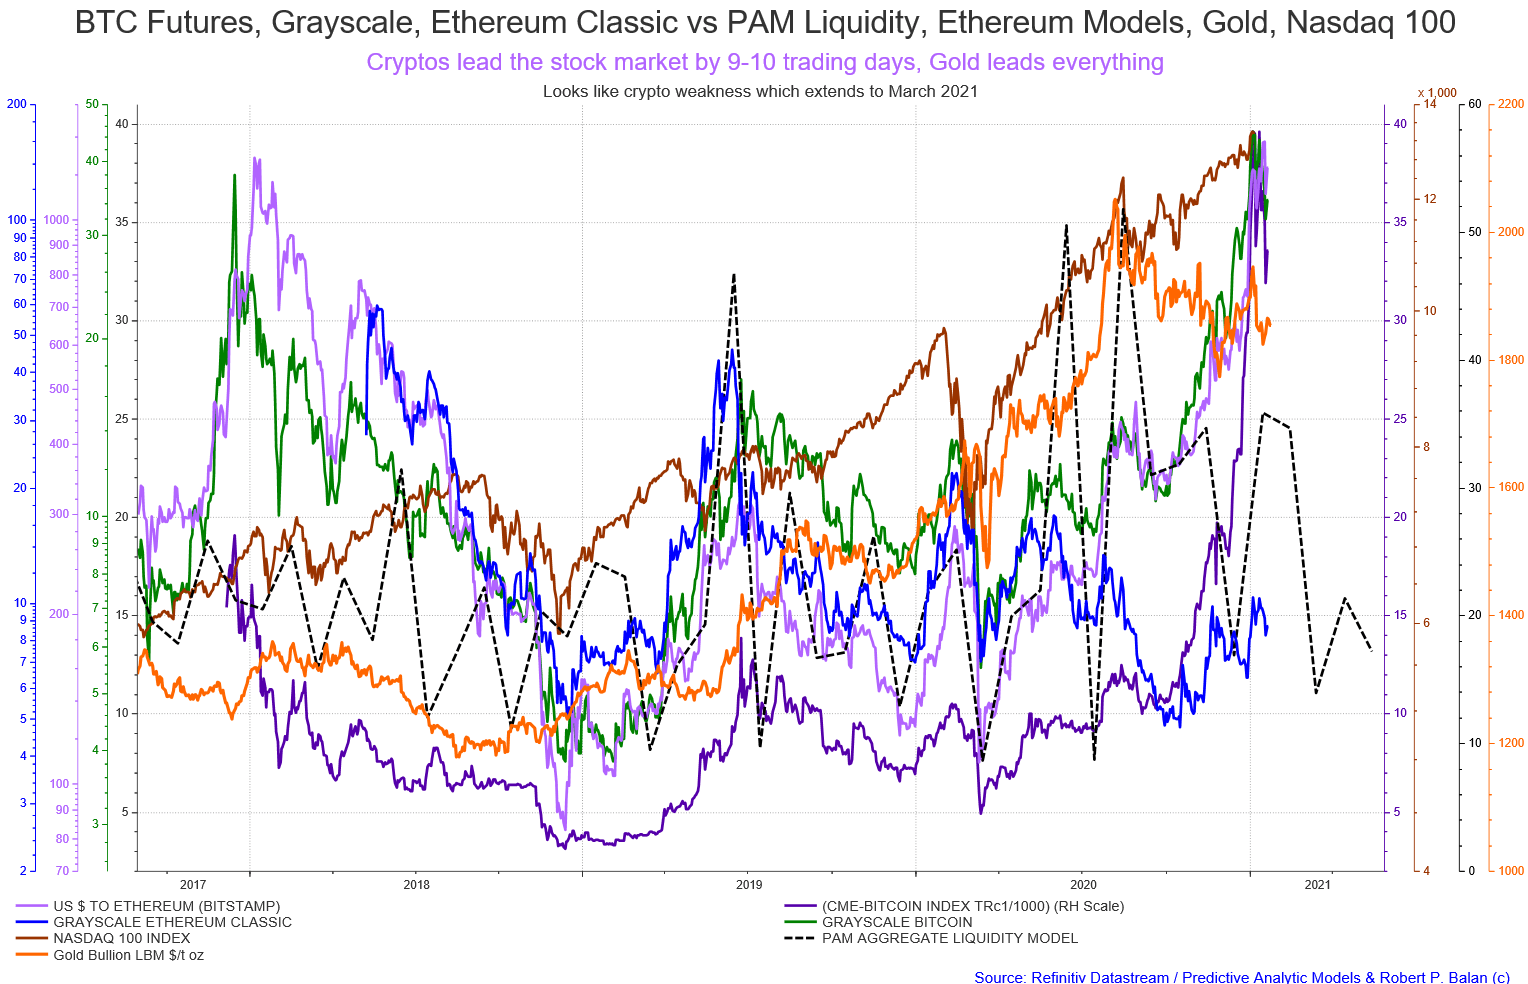
Here is a zoomed-in view:
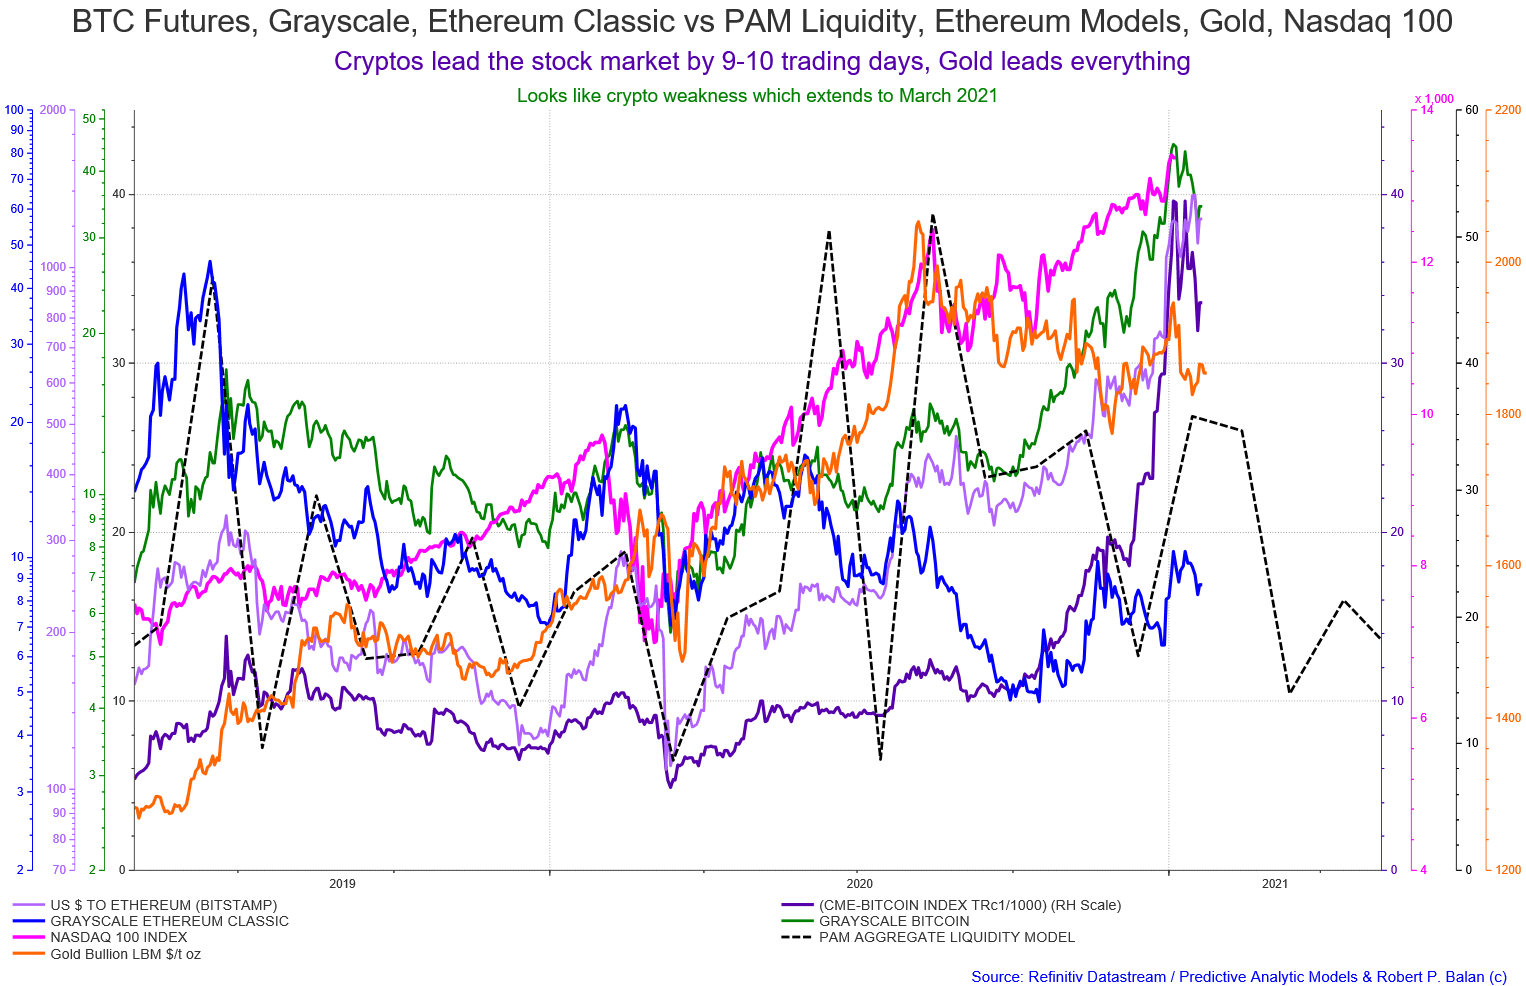
As we have been showing for some time now, a small pullback ends very soon, followed by a final rally, and then a top, followed by a significant decline. We have been showing this chart of our models for some time.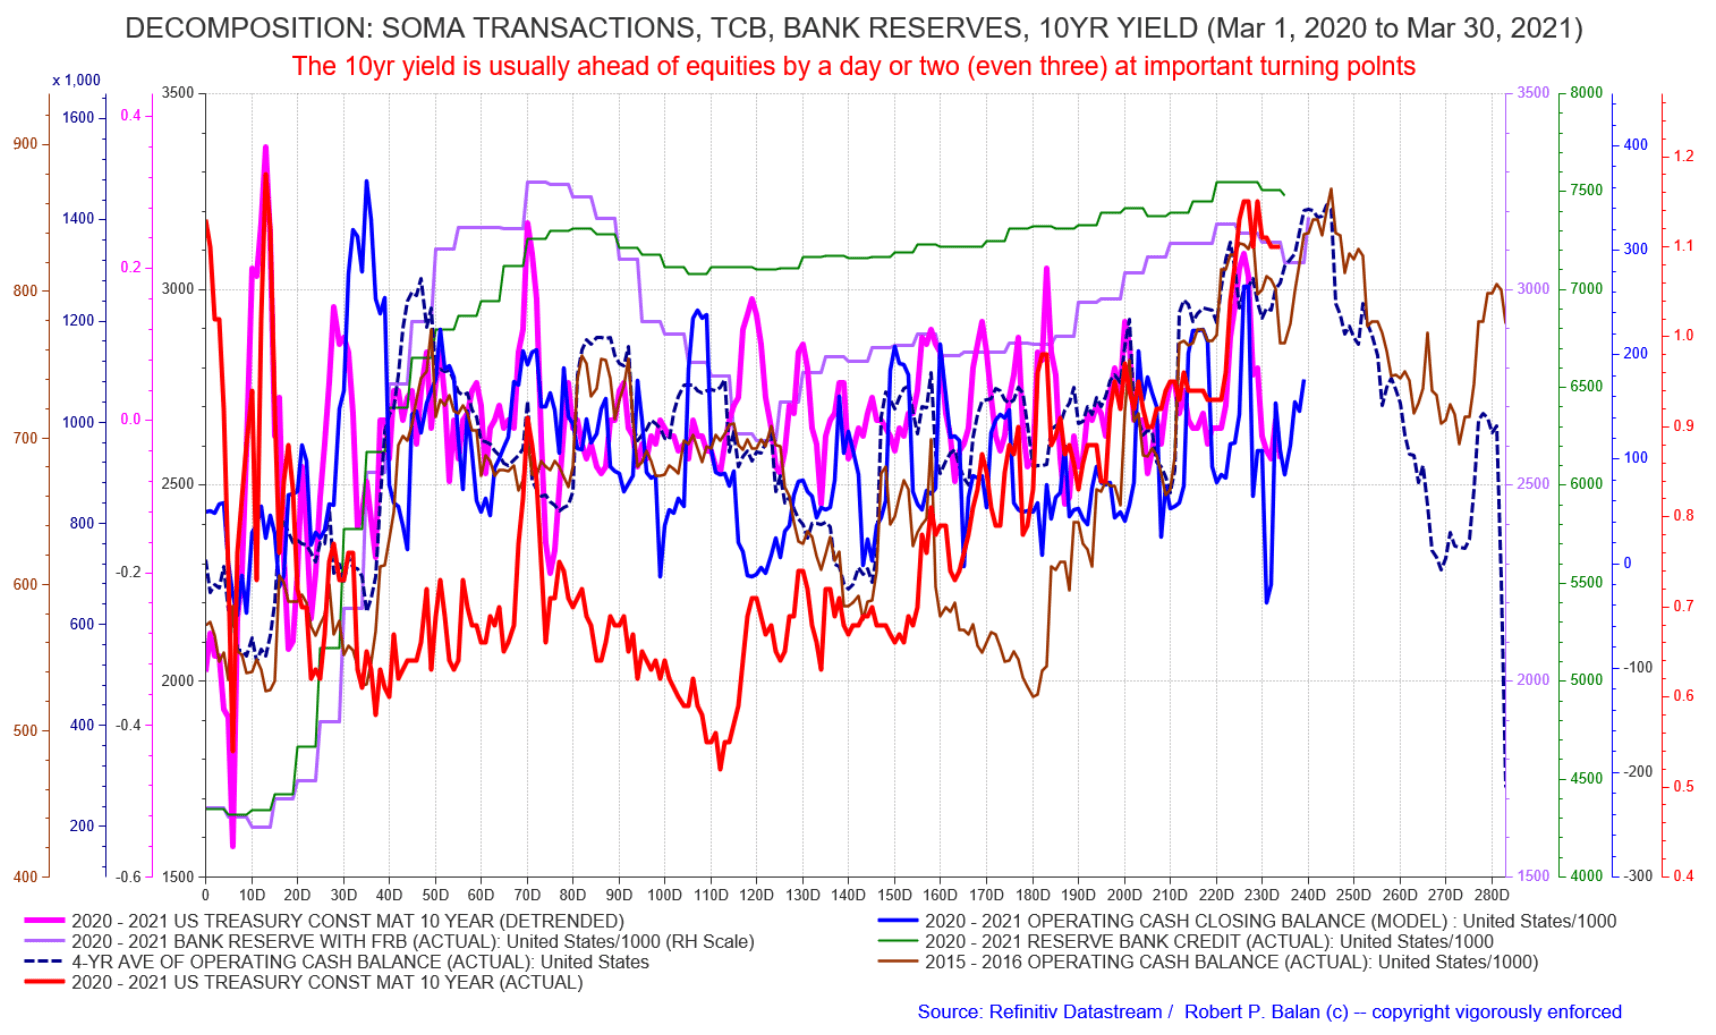
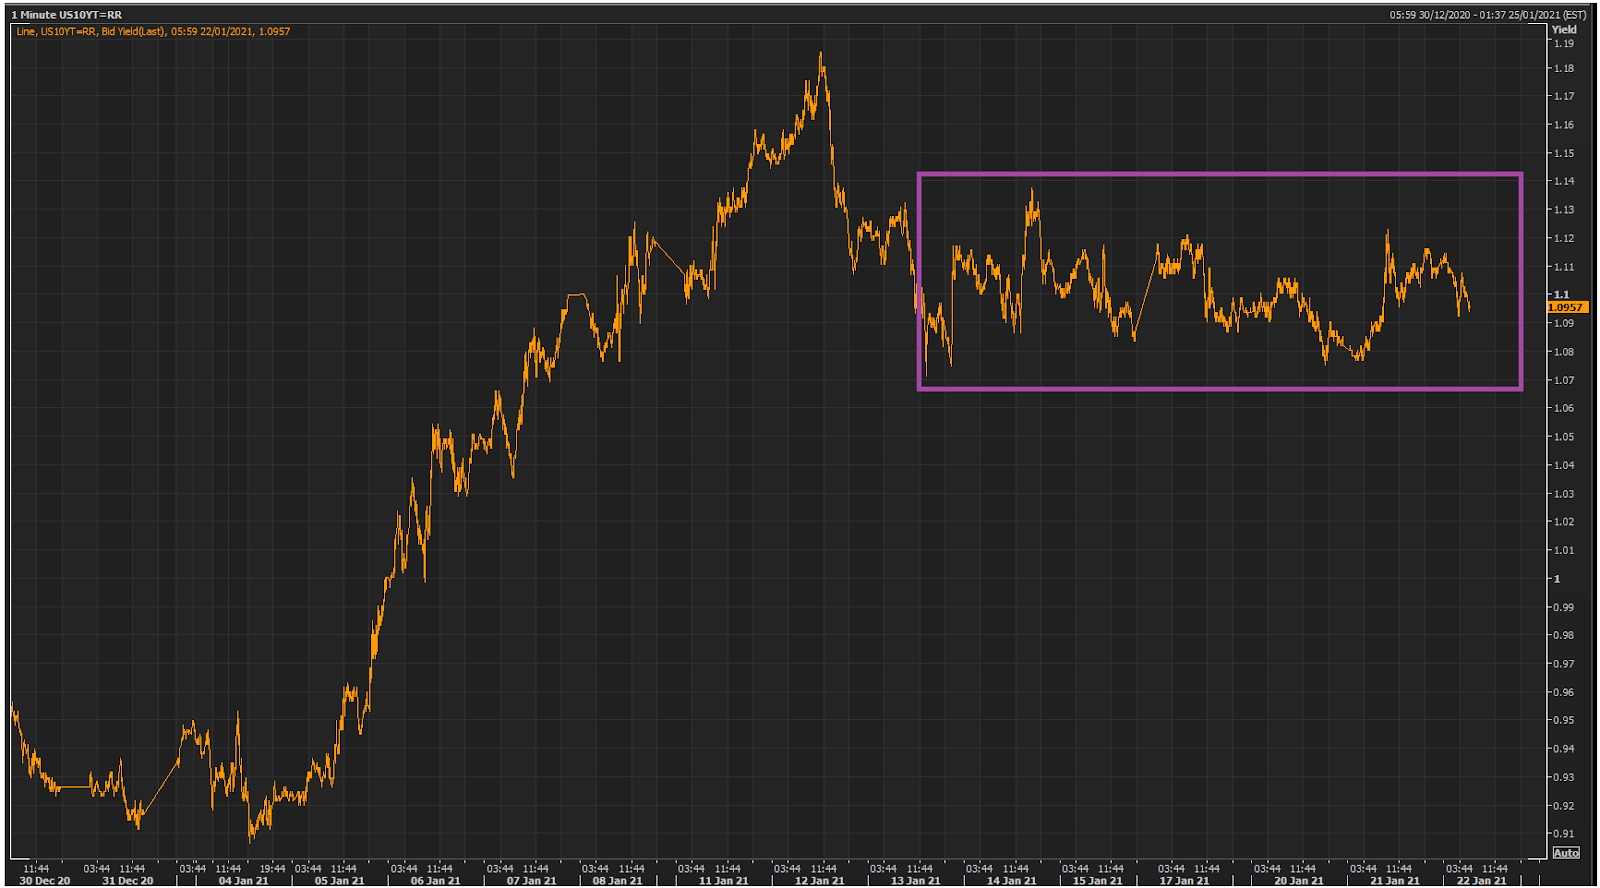
Yield moves still performing like a mid-way consolidation, but no idea when it start breaking below the 1.0750 support. That could come Monday in Asia, maybe.
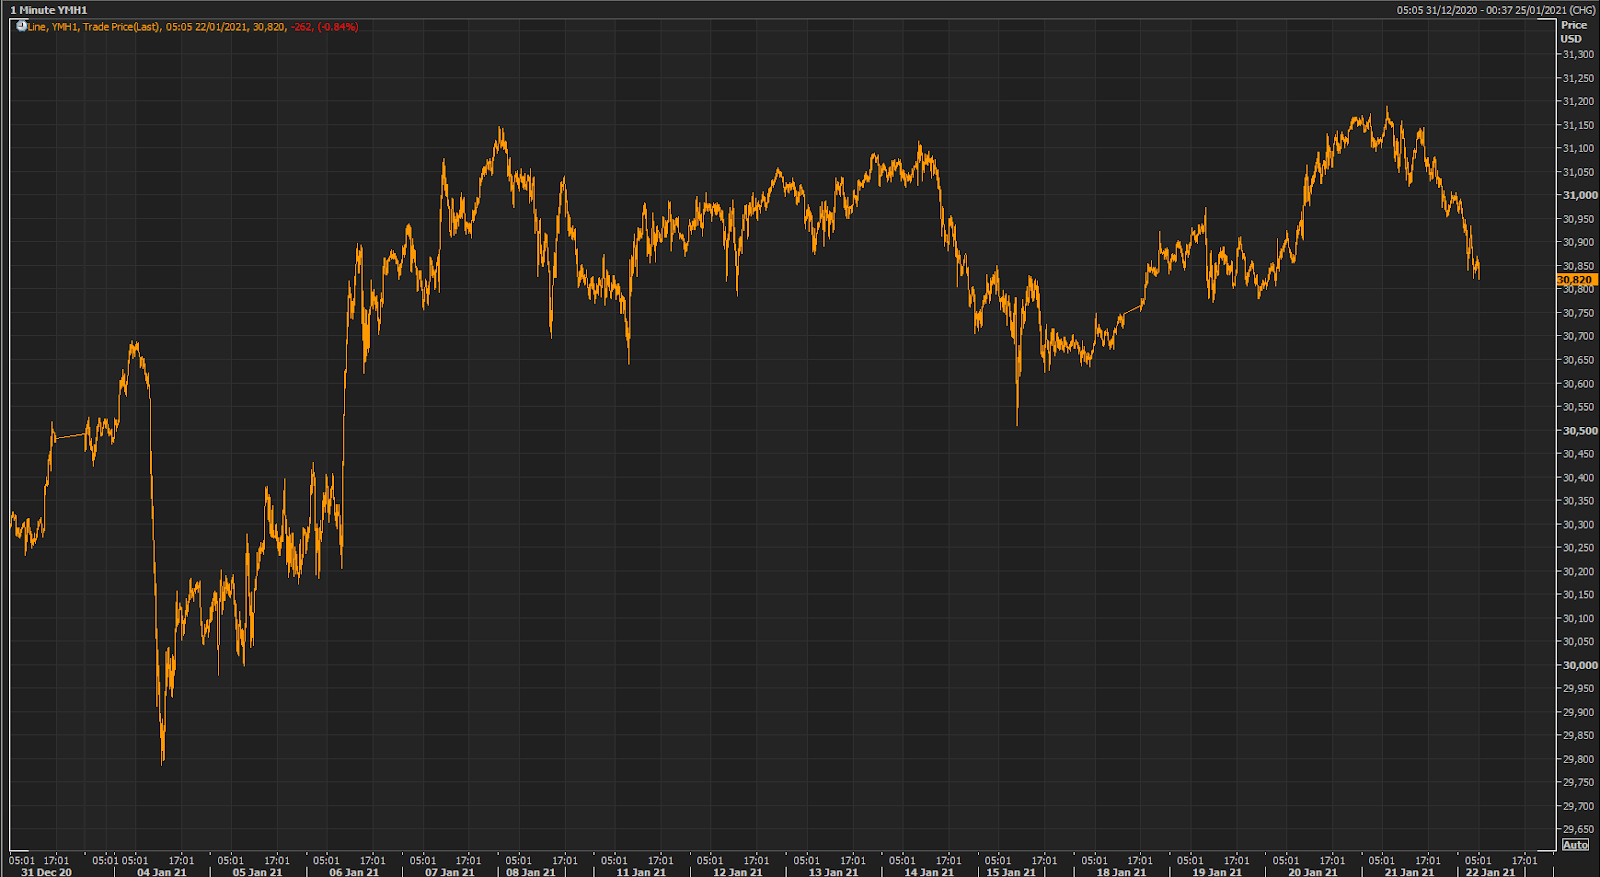
 But equity futures are falling, so TimKiser was wondering whether we should pencil in lower downside targets, lower than we have previously discussed and illustrated.
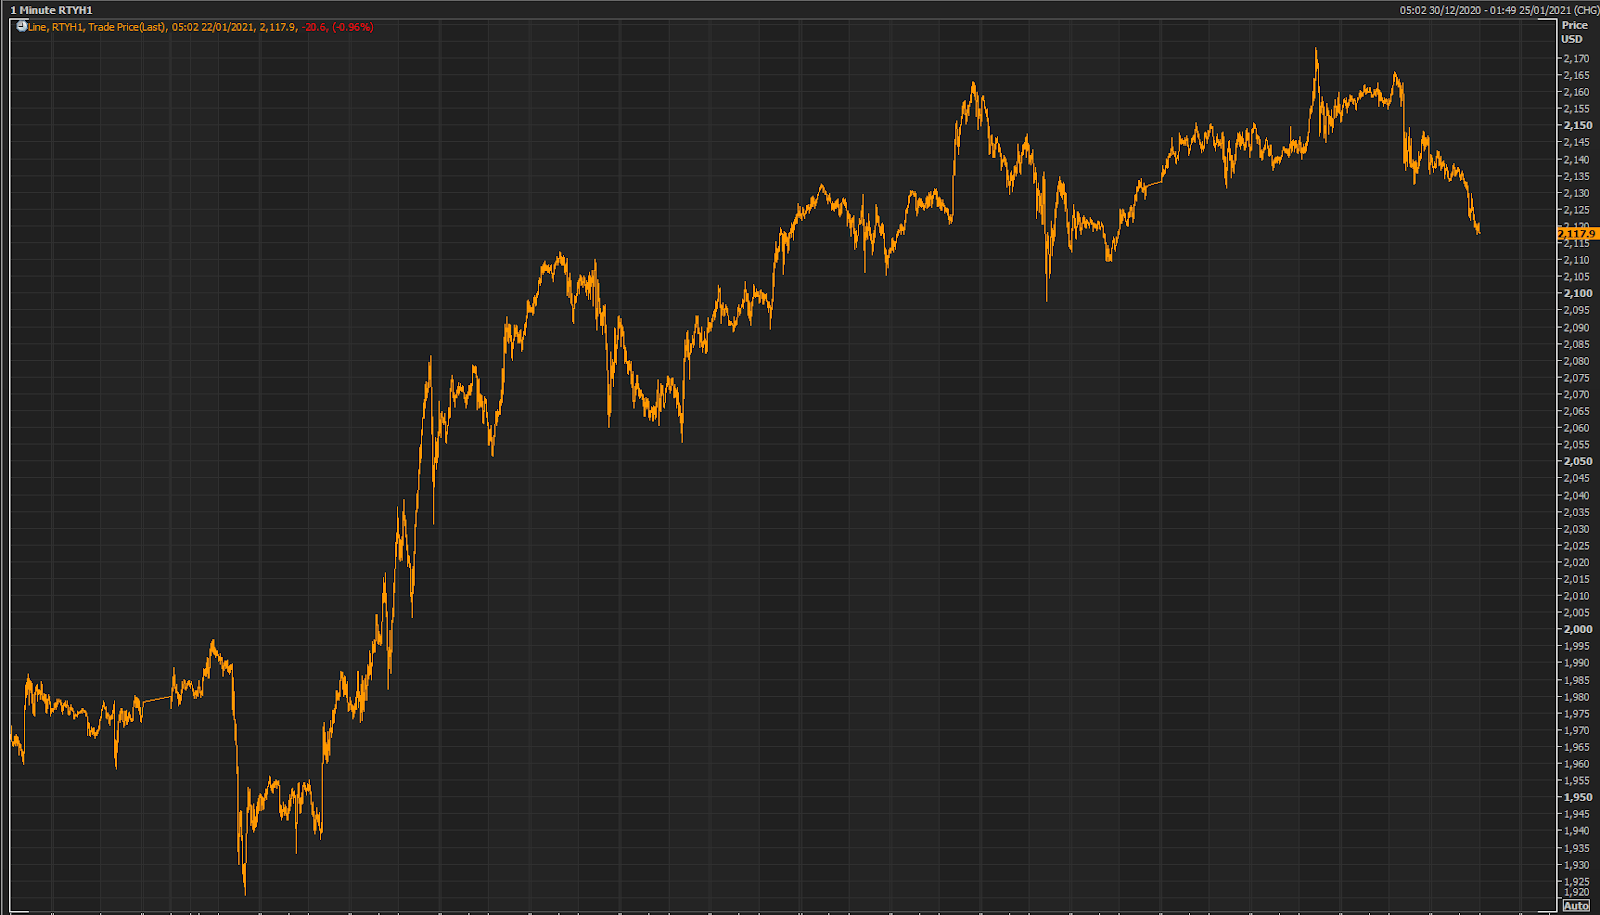 RTY above, and YM below.
 I prefer to see yields falling as well, but if we get the downside equity futures targets, with yields not falling commensurately, I will take profits anyway, and worry how to exit the long TN scalpers later.
If we go get a decent equity decline:
We will reinstate the 1000 contract ES overhedges in due time, but we decided to bet to the upside on two horses. So we will split the positioning to 500 contracts long NQ and 500 contracts long ES.
The 400 plus long ES contracts dedicated overhedge won't be touched until we are ready to offload the short strandees. The dedicated hedges will also be offloaded at the same time.If equities sink, gold may also decline.
Gold and equities have gone back into a positive covariance. And the Dollar should rise, as should be the case in a risk-off environment, which seems to be taking hold, for now.
We will reassess the market situation before NY lunch time today.
nichaJan 22, 2021 2:46 PM
Is your downside target for NQ still ~ 13,200? I have some shorts I want to get out of.
robert.p.balanModeratorLeaderOwnerJan 22, 2021 2:53 PM
nicha -- I am waiting to see if 10yr yield breaks below the 1.0750 support. If yes. NQ should go even lower.
The energy sector is starting to meet headwinds, as we explained yesterday. If you are long gasoline or crude oil -- offload those asap -- the crude oil sector is about to keel over. RPB gasoline and oil inventory models are suggesting that current oil inventory drawdowns are coming to an end.
WTI Extends Losses After Surprise Crude Build
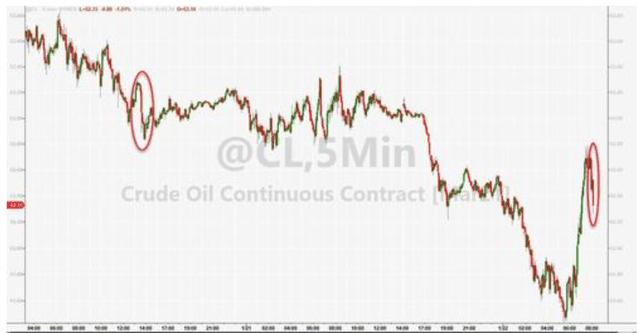
I am putting these two energy charts in the PAM Analytics channel, so y<ou can track them at your pace.
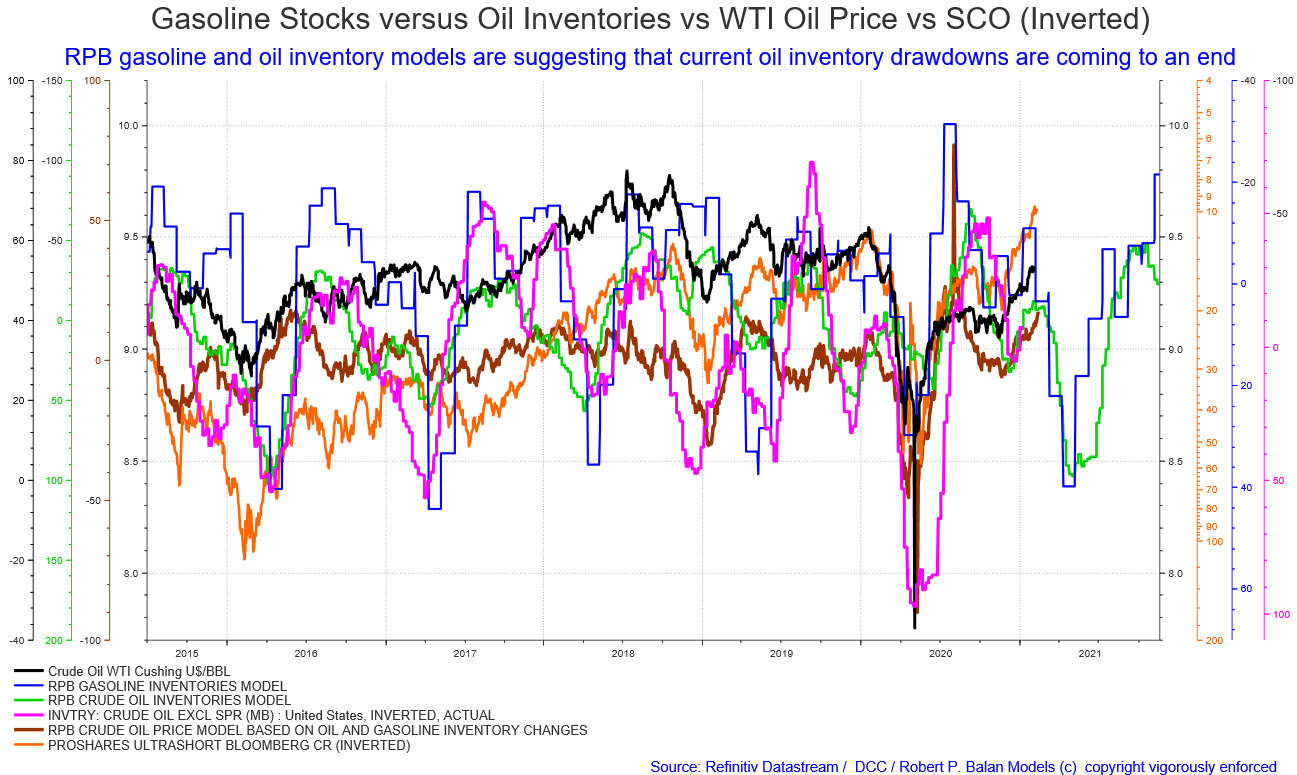
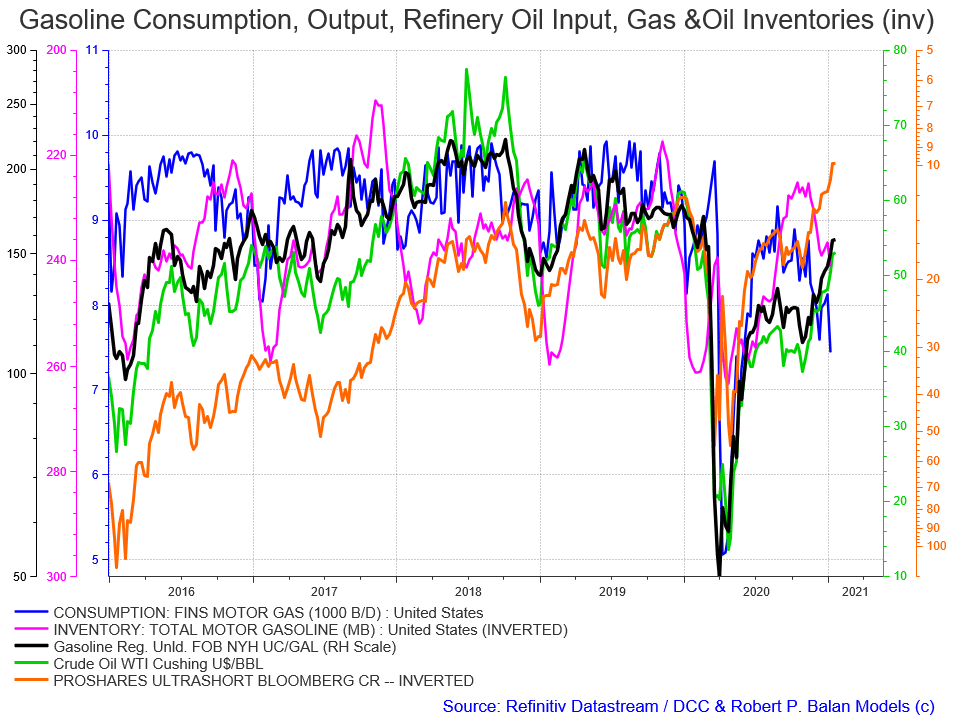
Waiting for the yields to fall further is like waiting for Godot. But we now have enough daylight between our short scalper levels and current market, so it would be tragic if we lose money on these trade.
We will now put in trail stops to breakeven, and then work the stop as/if the market goes lower.
AT 2,149.75 SOLD NEW 288 SCALPER CONTRACTS OF RTYH1
all PAM PUTS A TRAIL STOP TO BUY BACK 288 RTYH1 SCALPER CONTRACTS AT UPWARDS BREACH OF 2,149 (BREAKEVEN), GTC -- FOR ALL FUNDS.
AT 31,088 SOLD 288 NEW SCALPER CONTRACTS OF YMH1
all PAM PUTS A TRAIL STOP TO BUY BACK 288 YMH1 SCALPER CONTRACTS AT UPWARDS BREACH OF 31,087 (BREAKEVEN), GTC -- FOR ALL FUNDS.
robert.p.balanModeratorLeaderOwnerJan 22, 2021 6:07 PM
Yields head lower, but slow (even inverse) response from equities
PAM PUTS A TRAIL STOP TO BUY BACK 288 RTYH1 SCALPER CONTRACTS AT UPWARDS BREACH OF 2,149 (BREAKEVEN), GTC
*This order was filled.*
*RTYH1 -- DONE AT 2,149.35 BOUGHT BACK 288 RTYH1 CONTRACTS AT BREAKEVEN, FOR ALL FUNDS.*
nichaJan 22, 2021 9:39 PM
Not much effect of yields on equities. This rally is unstoppable.
john.derJan 22, 2021 11:27 PM
Today could have been b-wave up. No clear direction unless new high is struck, imho.
TimK123Jan 23, 2021 12:01 AM
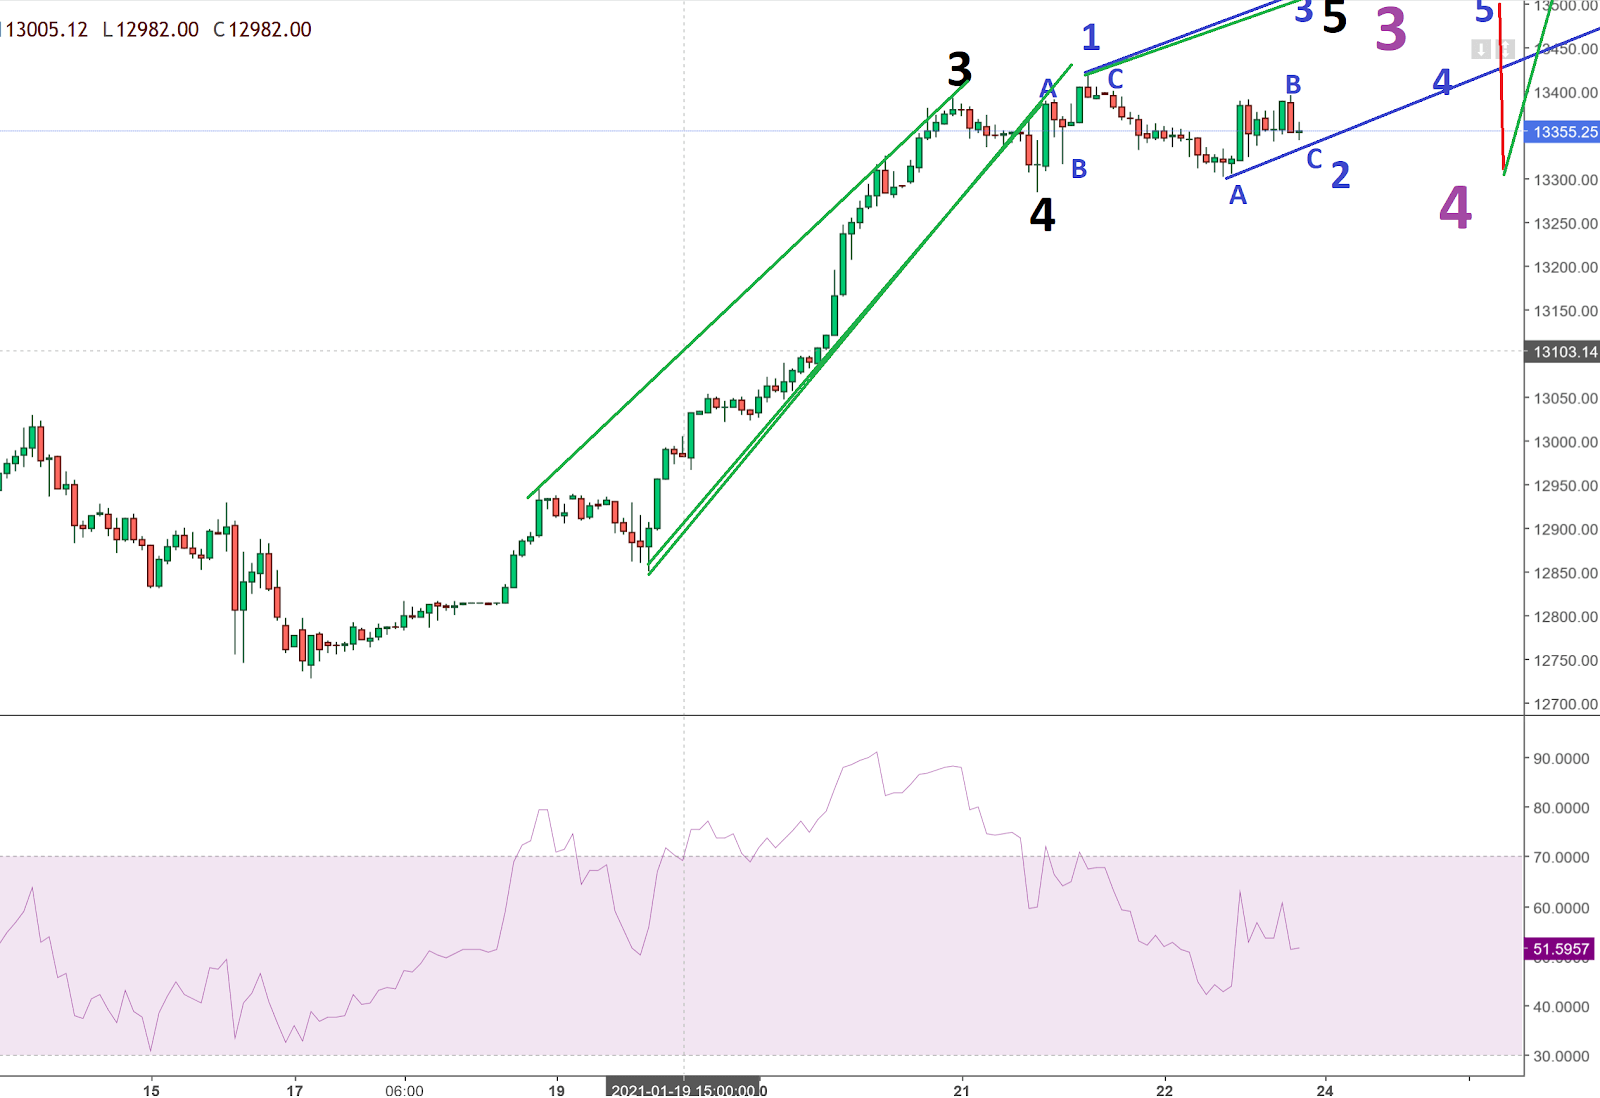
Think NQ is setting up a diagonal W5 John. Could explain the choppy moves, could well have been the B wave, hence the two 5 wave moves up then a dump. However, the C wave might not make new lows now as a channel might be forming. The last peak was so strong it almost had to be a W3/3, I think the W4 might be done now and we're seeing a diagonal being born (wedge or channel), soon find out:
TimK123Jan 23, 2021 12:01 AM
TimK123Jan 23, 2021 12:04 AM
The black W4 I illustrated touched W4 level of the massive W3, so that's mission accomplished (larger W4 hitting the W4 of a lesser degree, before turning up again).
TimK123Jan 23, 2021 12:09 AM
There are ABC moves in diagonals to make up their 5 waves BTW. A and C still have 5 subwaves and B has three, but the overall structure is ABC rather than 12345 in diagonals to form the 1, 3, and 5. So W1 goes ABC rather than 12345, W3 and W5 do too. Hope that makes sense and explains why I illustrated it like that.
ABCs in the main trend direction are kind of like forced move I think when a full 5 waves can't be accommodated, sometimes seen in forex too from memory as their main motive waves, as their bread and butter, as the market pressure is larger preventing a full 5 wave move.

Comments
Log in or sign up to join the conversation.