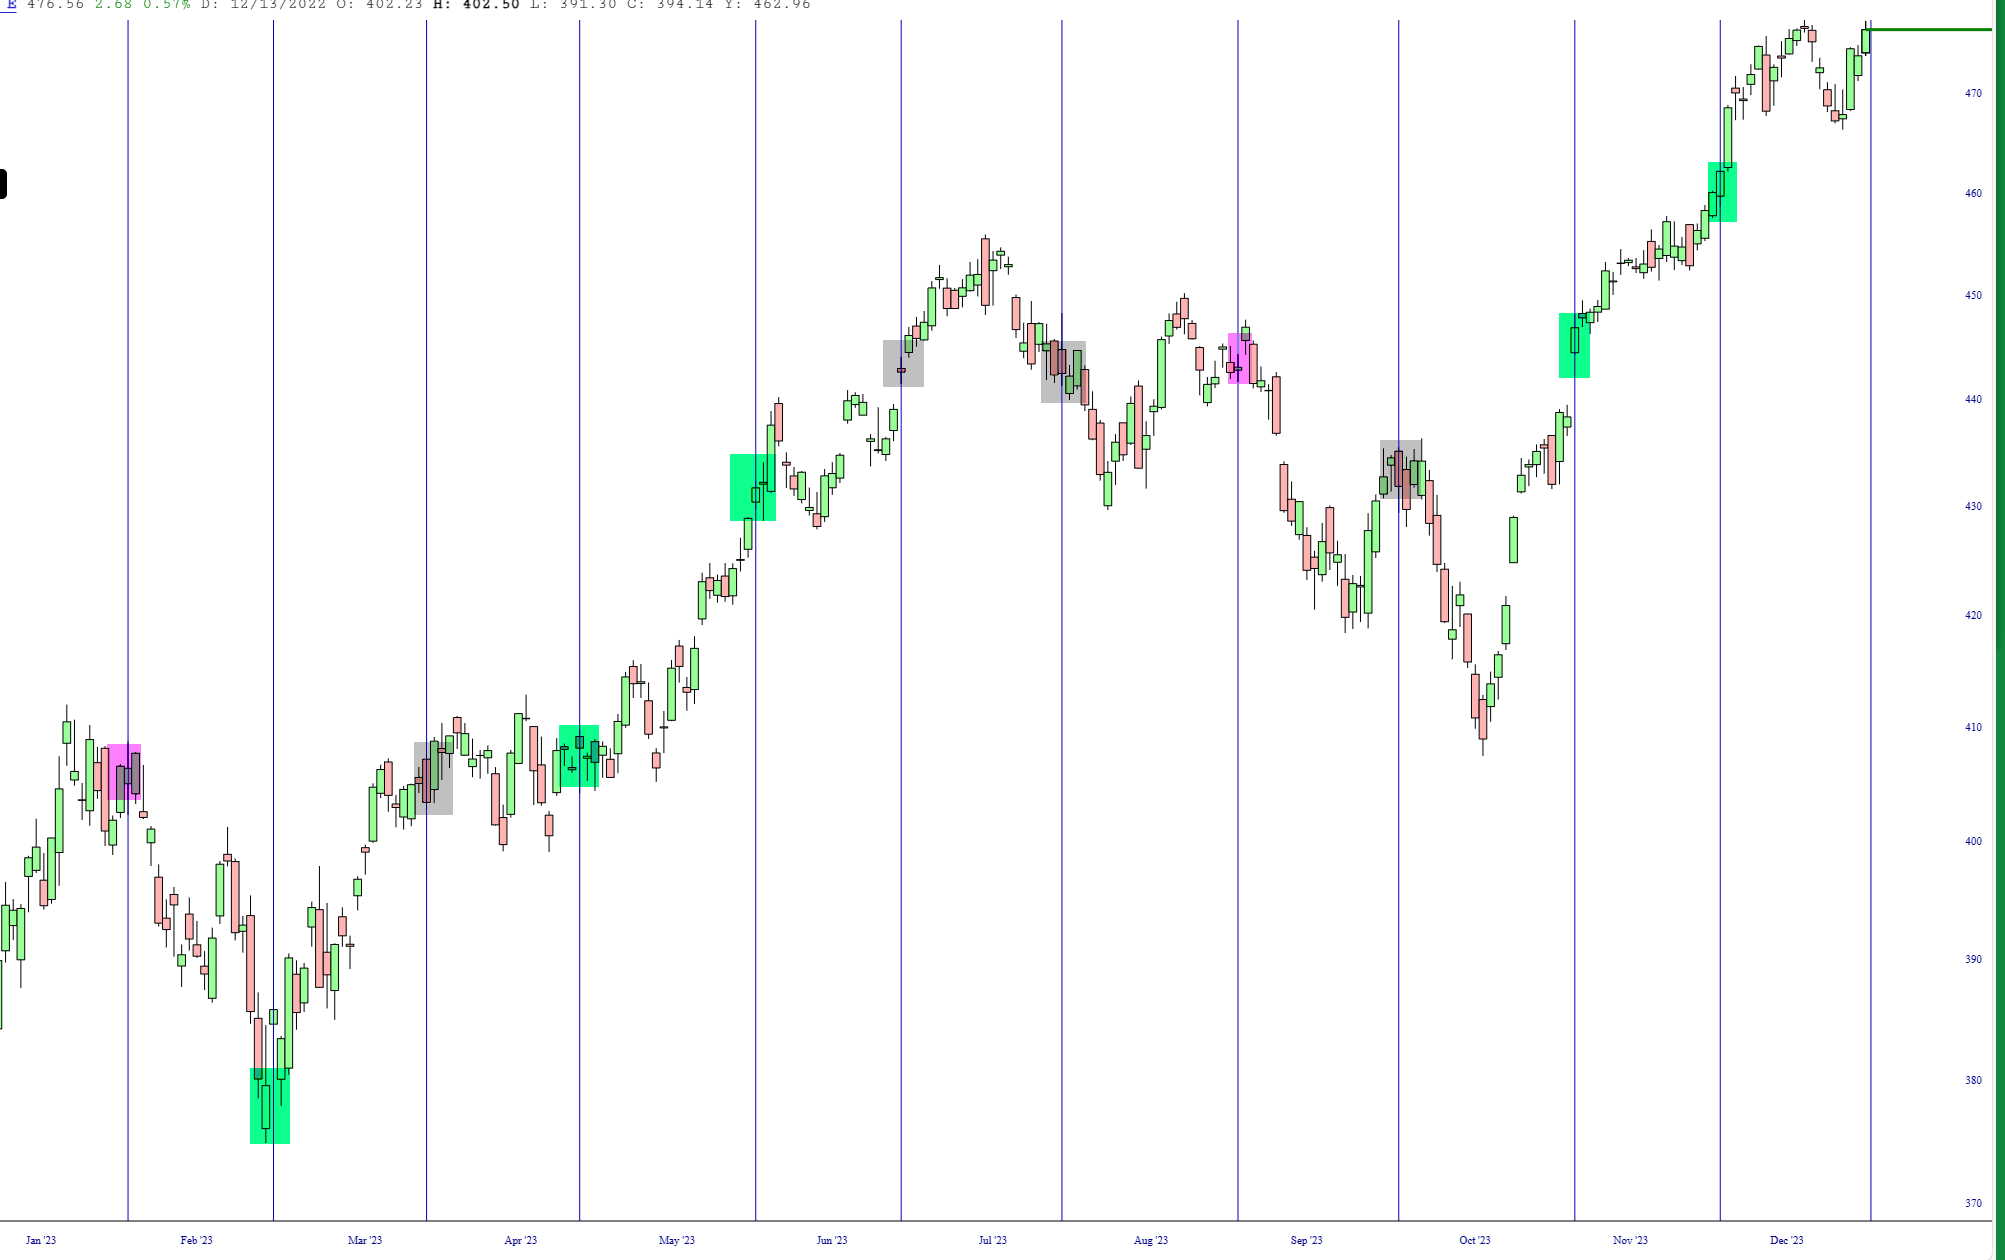
Here is a chart I put together of the SPY with a vertical line denoting each monthly CPI report. Let’s see what Thursday morning holds, with the market presently at lifetime highs.
Here is a chart I put together of the SPYwith a vertical line denoting each monthly CPI report. This is all thanks to our spiffy Event Markers feature! The green tint indicates reports that led to a generally bullish month, the magenta for bearish, and grey for neither. As you can see, the last two reports simply egged on the bulls. Let’s see what Thursday morning holds, with the market presently at lifetime highs.
I tilt to the bearish side. Slope of Hope is not, and has never been, a provider of investment advice. So I take absolutely no responsibility for the losses – – or any credit for the gains – – you may or may not make from reading this forum. Whether you lose your life savings or make a fortune is entirely up to you and your own skills/luck/fate.


Comments
Log in or sign up to join the conversation.