Managing Owner and CIO, Predictive Analytic Models (PAM)•
Share:
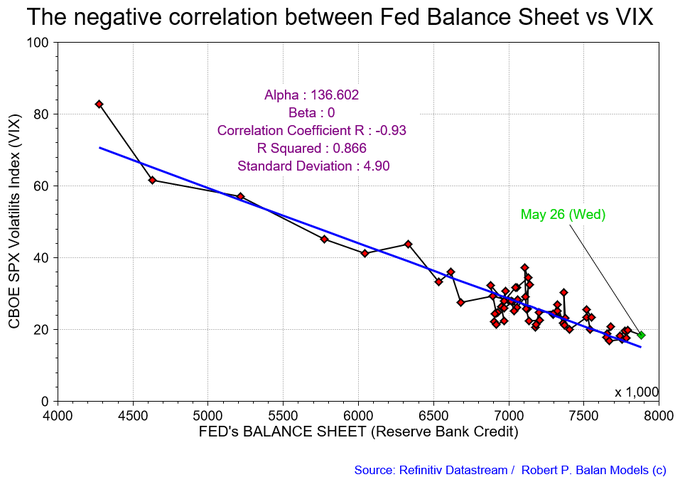
Updating the charts that had my eyes popping: Changes in the Fed balance sheet Granger-causes VIX changes (0.93, corr coef., from 0.926), and explains 86.6% of (R^2), from 86.3%, from March 16, 2020, to-date
1/2 Updating the charts that had my eyes popping: Changes in the Fed balance sheet Granger-causes VIX changes (0.93, corr coef., from 0.926), and explains 86.6% of (R^2), from 86.3%, from March 16, 2020, to-date (below).
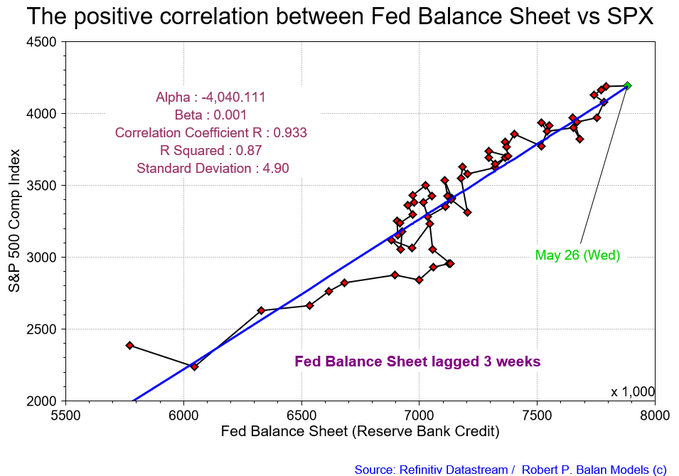
2/2 There's now increased corr coef between Fed balance sheet and SPX (0.933, from .914), higher R^2 (87.0% from 83.5%) when there's a 3-week lag. Numbers are weaker w/ no lag I see this lagged effect in my model work. Fed B/S changes impact SPX to max effect only after 3 weeks.
Disclaimer:This and other personal blog posts are not reviewed, monitored or endorsed by
TalkMarkets. The content is solely the view of the author and TalkMarkets is not
responsible for the content of this post in any way. Our curated content which is
handpicked by our editorial team may be viewed here.



Comments
Log in or sign up to join the conversation.