
The S&P 500 was up nearly 5% during the past trading week and is now down only 1.14% year-to-date. After falling some 34% from February 20 - March 23rd, the benchmark index has demonstrated the greatest 52-day rally in history. The number of unprecedented statistics and records the market has set in 2020 are too numerous to list. While the depth of the decline was met with fear and loathing, those emotions have turned to bullishness and found some metrics with euphoric readings.
Over the last week or so several analysts/strategists that I follow from time to time have now turned bullish or at the very least are recommending an increase in equity exposure. For some, that’s a tough pill to swallow if one has heeded their advice and are now “forced” to put cash to work after the 40+% eye-popping surge off the March lows.
Weakness is being bought in perpetuity, cash is being rotated to different sectors of the market. If we stay with the mantra of “Keeping it Simple” that is all one needs to know right now; money is indeed rotating. Those that over-analyzed the stock market in early April, as they desire perfect conditions, are in a quandary now. It’s best not to join them by forsaking good in the search of perfection.
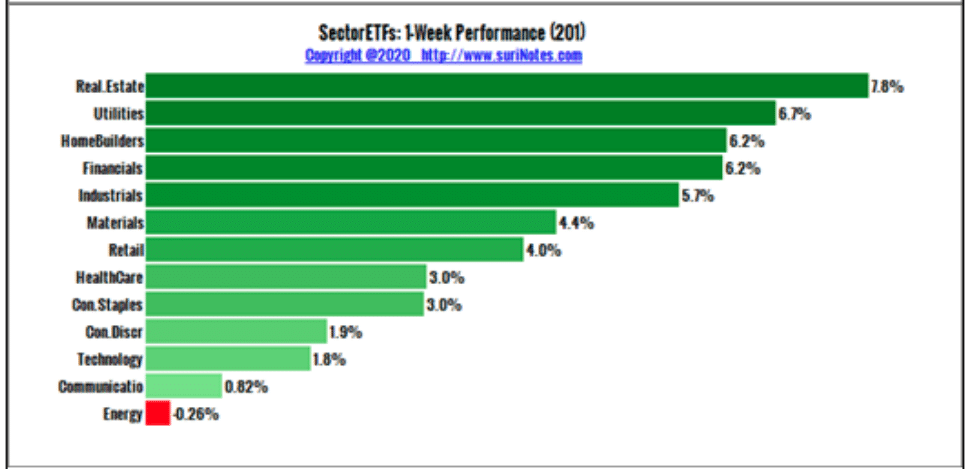
As a reminder for the sector level performance, this is what we saw last week with the cyclicals leading the way out of the bear market and into a new bull market.
This past week, we saw much of the same, except Energy caught up again and was the leading sector performer for the week.
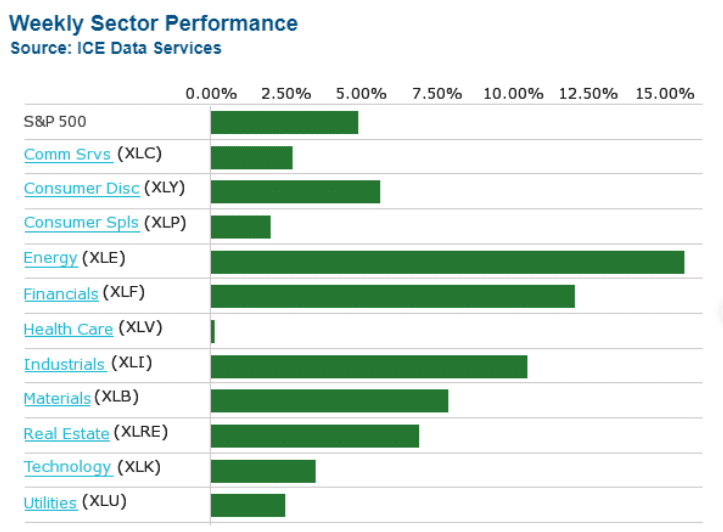
Cyclicals were extremely strong with Financials continuing a 3-week long outperformance when compared to more defensive sectors like Utilities, Consumer Staples and Health Care. On top of strong sector performance, the breadth in the market remained quite robust. One of the "things" we wanted to see from the market over the last several weeks was broadening market breadth whereby more and more stocks were participating in the markets' rally and not just the big mega-cap names like the FAANMG cohort of stocks. We were not disappointed!
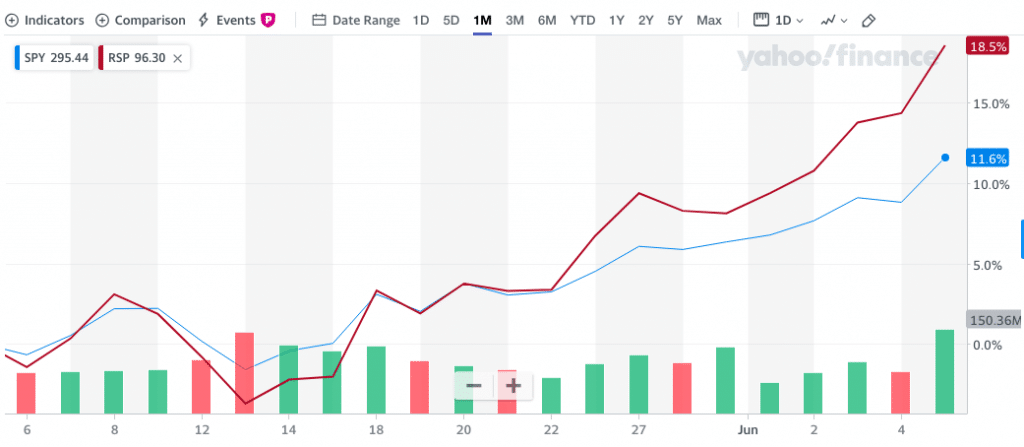
The most simplistic way to review market breadth is through the lens of the Equal-weight S&P 500 index ETF (RSP). Just about 3 weeks ago the RSP hit a relative new low when compared to the Cap-weight S&P 500 index ETF (SPY).
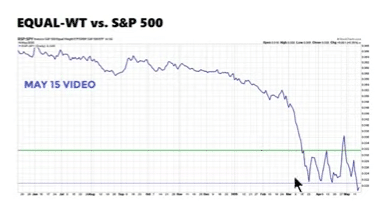
That chart was deeply concerning because it suggested not many stocks were participating in the markets' rally off of the March 23rd lows. But things have very much changed over the last 3 weeks as we can see in the following chart of the RSP:SPY:
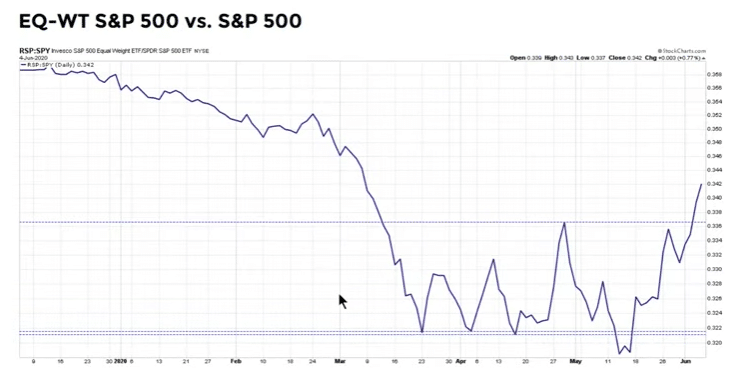
This reinforces the need to remain open-minded and while the chart in front of us at any given time may look ominous, it is also a ongoing a forever-developing situation. This particular situation developed into a new bull market, but of course, that will not always be the case. To kind of put a pin and finer point on the subject of market breadth using the RSP:SPY relative performance, the chart below shows the 30-day performance of both ETFs. You can see that the RSP has advanced ~7% more than the SPY over this time period. This is suggestive of a healthy, new bull market and not one that is simply propped-up by a handful of mega-cap tech and consumer discretionary names like Home Depot and Amazon.
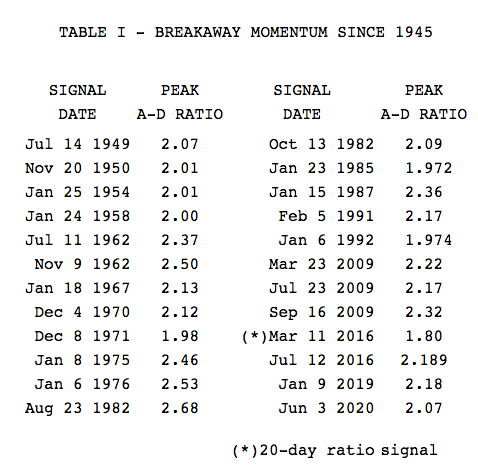
Beyond RSP:SPY breadth analysis we witnessed the firing of a couple of breadth thrusts this past week. The first breadth thrust to "fire" was a Break-Away Momentum (BAM) breadth thrust
- The first breadth thrust is called a Break-Away Momentum breadth thrust or BAM. (Walter Deemer)
- Breakaway momentum occurs when 10-day total advances on the NYSE are greater than 1.97 times a ten-day total NYSE declines. It is a relatively uncommon phenomenon, occurring only 23 times since World War II (an average of once every 3 1/2 years). Cyclical bull markets, though, are traditionally heralded by break away momentum
- Post-BAM declines/corrections tend to be surprisingly brief and shallow given the amplitude of the BAM-generating advance.
- When the train leaves the station it doesn’t back up to let late-comers get aboard.
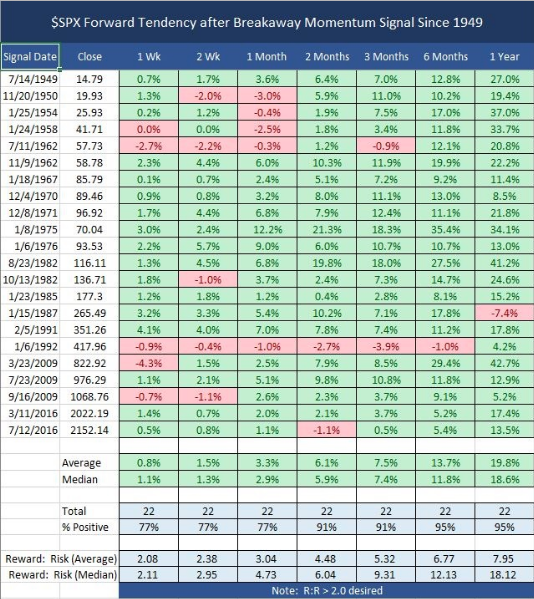
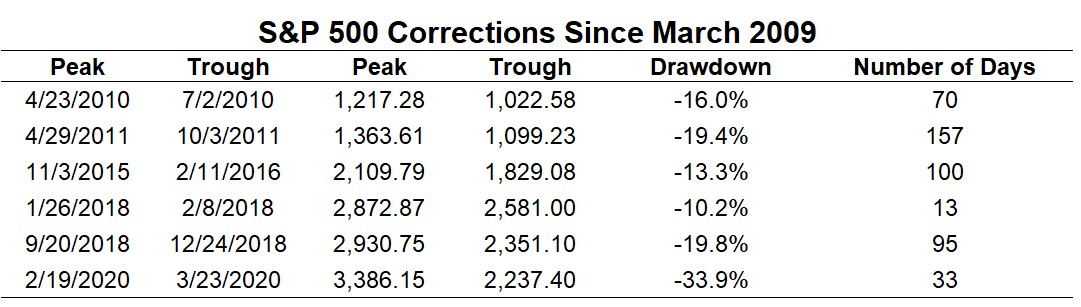
In speaking to the table of forward-looking performance for the S&P 500 after firing a BAM breadth thrust, we think it's also important to note the maximum drawdown identified in the historic data. Over the next 3-6 month time period, the maximum drawdown after firing a BAM breadth thrust historically was just 4.3% in 2009, which came 1-week after the breadth thrust was fired.
- If that is the worst the market might deliver, we'd be of the opinion that's not so bad and speaks to opportunity
- This was also the worst drawdown over the next 3-6 month period of all historical cases.
- Keep an open mind, even as the media will aim to connect drawdowns with fear-driving coverage. We've seen how fear-driven, worst-case scenario promoting usually ends. It usually ends without the worst-case scenario coming to fruition.
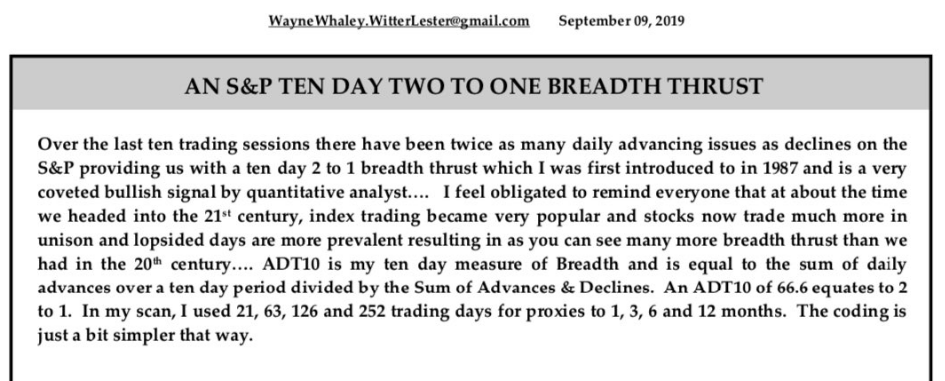
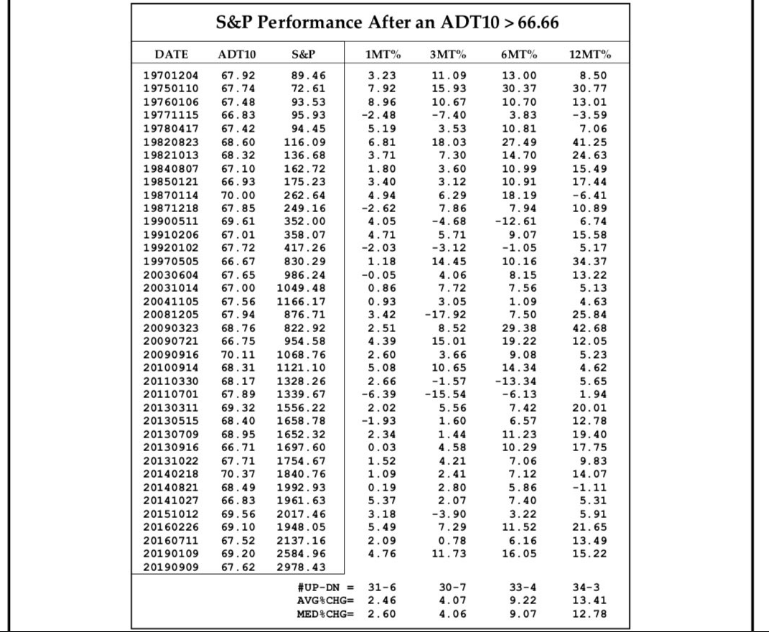
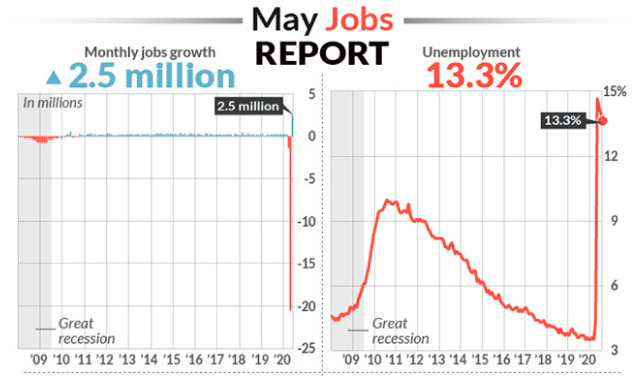
Then came Friday and on Friday a Whaley Breadth thrust was "fired". The breadth thrust came on the heels of an unforeseen and un-forecasted May Nonfarm Payroll growth report which showed some 2.5mm jobs were added in the month of May. The forecast was for a decline of roughly -8mm. Many traders were caught offside and forced to quickly reposition. We can see some of the repositioning that occurred even before Friday's S&P 500 advance of 2.7% within the latest CoT (Commitment of Traders) report.
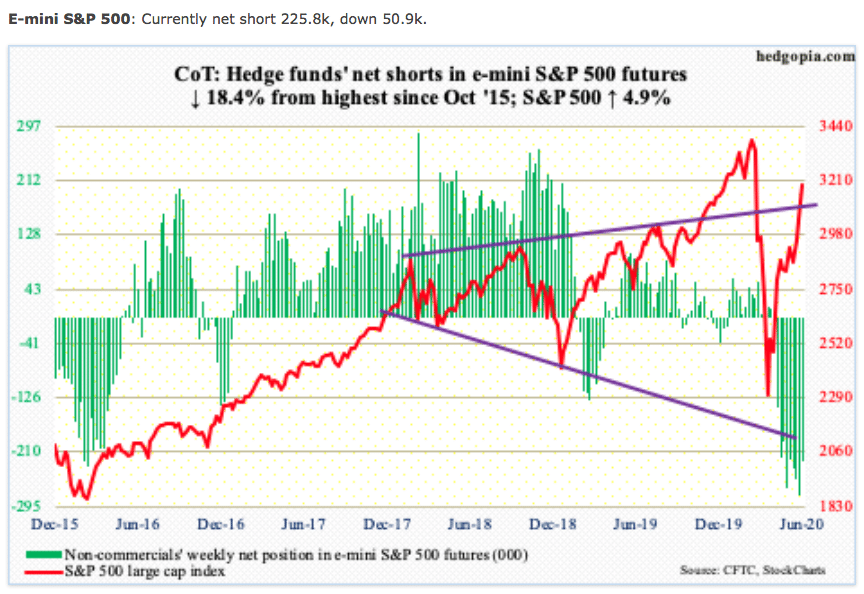
As shown in the chart above (green lines), the short interest in E-mini S&P 500 futures dropped WoW by roughly 50K contracts. That's a heck of a lot of short covering! But with respect to the Whaley Breadth Thrust that was triggered on Friday, here are some definitions below:
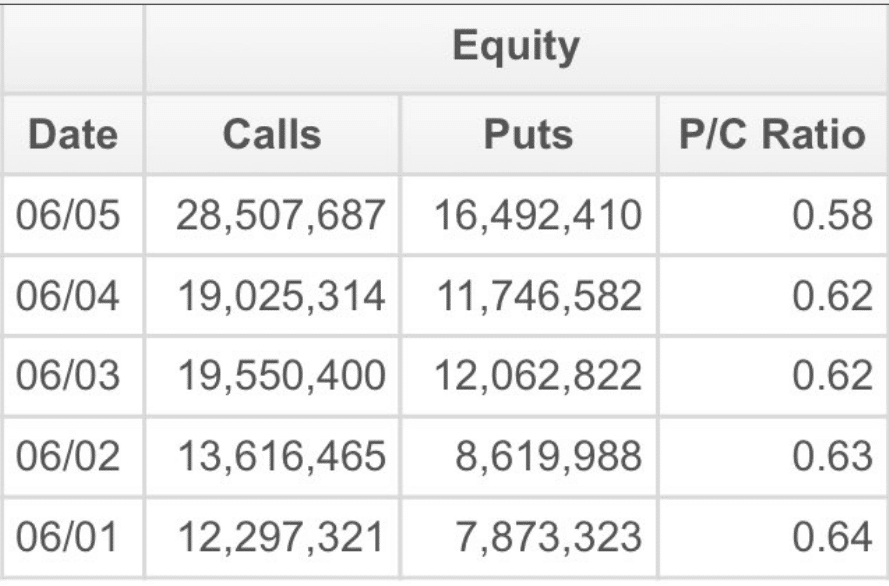
Did I fail to mention the record call option activity this past week and on Friday? Because this is something you don't see to often. It also tends to find a mean reversion
There has been an immense amount of buying and short-covering activity over the course of the last couple of weeks which has resulted in the S&P 500 producing 3 consecutive weeks of 3% or greater gains. This feat of strength or trend has only happened 1 other time in history, 9/03/1982. To reiterate, there has been an immense amount of buying and that buying over the last 3+ weeks has pushed the S&P 500 up by more than 10% the last 20 days. With such constant upside pressure in the index, naturally, the 14-day RSI has signaled an overbought reading.
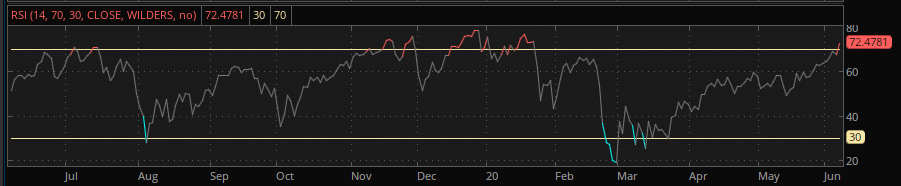
This is the first overbought reading for the RSI(14) and first reading over >70 in 50-trading days. The only dates that match this occurrence and criteria are:
- 6/5/2020
- 3/23/2000
- 11/16/1999
- 11/4/1998
- 1/27/1975
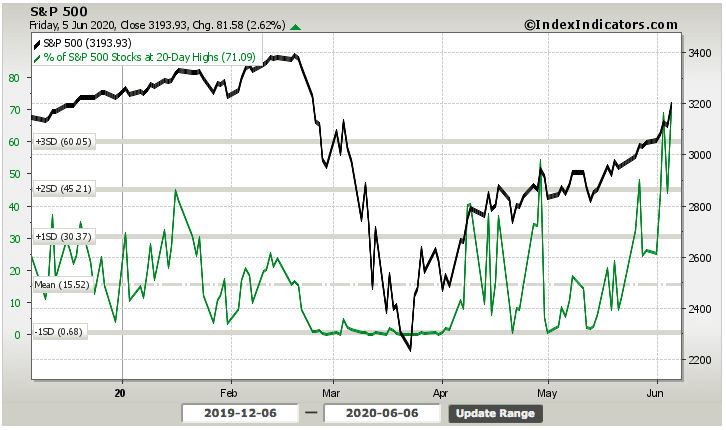
In conjunction with many overbought conditional signals such as the percentage of stocks trading above their 50-DMA and the percentage of stocks trading at their 20-day highs (71% chart below), it's clear that records are continuing to be set in this former bear < > bull market scenario!
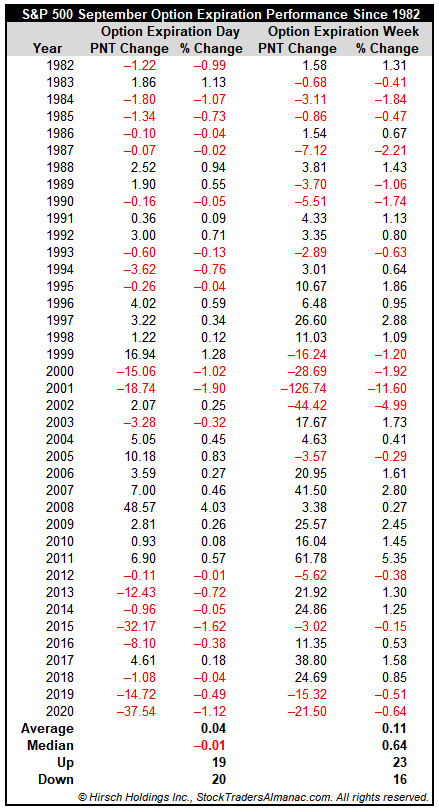
With respect to Friday and the greater than 2% gain while also recording its first RSI(14) reading above 70 in 50 trading days, it would prove interesting to know how many times this has happened in the past. Furthermore, it would probably prove even more interesting to know how the S&P 500 performed going forward, using this occurrence. Such studies can help us to understand the probabilities of future market performance, but of course, they are not guarantees and we've seen many a market study in the recent past fall short of foreshadowing the 2020 market performance.
What happened on Friday is actually quite a rarity! The table below identifies 11 times the market was up greater than 2% on a Friday with the RSI getting to 70 or better after 50 trading days.
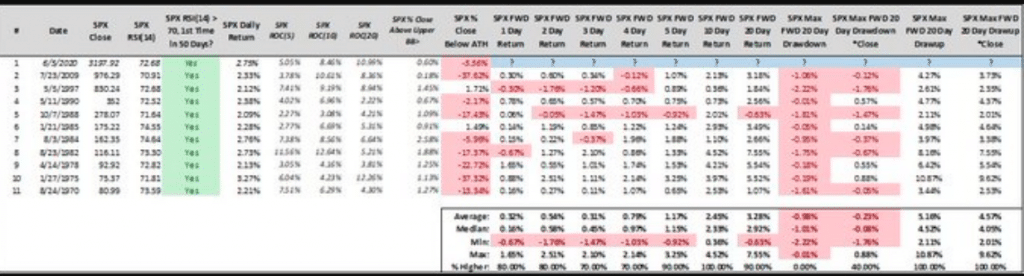
What's most interesting is that there's not a whole lot of red on the table. From the 1-day through 20-day period after, the average and median returns are all positive. Additionally, 10-days out there has never been a red occurrence (down day). By combining the RSI showing extreme strength in the S&P 500 alongside strong market breadth and breadth thrust having fired during the week, one could make the argument that the study above identifies "momentum begets momentum".
Another metric I monitor is TRIN. TRIN is also known as the Arms Index. What is TRIN?
- The Arms Index also called the Short-Term Trading Index (TRIN) is a technical analysis indicator that compares the number of advancing and declining stocks (AD Ratio) to advancing and declining volume (AD volume). It is used to gauge overall market sentiment. Richard W. Arms, Jr. invented it in 1967, and it measures the relationship between market supply and demand. It serves as a predictor of future price movements in the market, primarily on an intraday basis. It does this by generating overbought and oversold levels, which indicate when the index (and the majority of stocks in it) will change direction.
KEY TAKEAWAYS
- If AD Volume creates a higher ratio than the AD Ratio, TRIN will be below one.
- If AD Volume has a lower ratio than AD Ratio, TRIN will be above one.
- A TRIN reading below one typically accompanies a strong price advance, since the strong volume in the rising stocks helps fuel the rally.
- A TRIN reading above one typically accompanies a strong price decline, since the strong volume in the decliners helps fuel the selloff.
- The Arms Index moves opposite the price trajectory of the Index. As discussed above, a strong price rally will see TRIN move to lower levels. A falling index will see TRIN push higher.
Ok, so now that we know what TRIN is and what to look for we reiterate… If AD Volume has a lower ratio than AD Ratio, TRIN will be above one! A TRIN reading above one typically accompanies a strong price decline, since the strong volume in the decliners helps fuel a selloff. Now here is the latest look at TRIN from this past trading week:
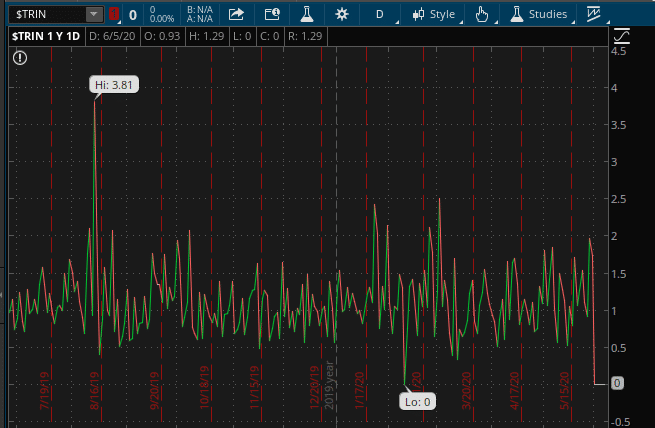
TRIN finished Friday at basically 0 or below 1 indicating AD Volume was a higher ratio than the AD Ratio and indeed we saw a very strong advance in S&P 500 price Friday. In short, when we combine the 14-day RSI above 70, the various breadth thrusts firing, the TRIN, the percentage of stocks trading at 20-day highs advancing to 71% and the S&P 500 trading nicely above its 200-DMA, we have all the validation that we need to claim a new bull market. Naturally, this does not mean the market won't be met with turbulence and/or consolidation periods here and there and especially given the overbought signals, but rather it suggests one should use such pullbacks as buying opportunities.
In addition to all the overbought conditions and bull market confirmations noted above, it would appear that investors have grown rather complacent.
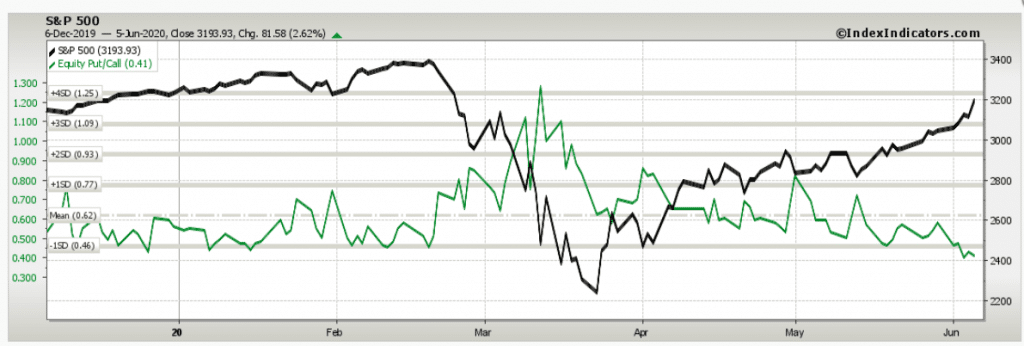
The Equity Put/Call ratio (green line) fell to a low of .41 to finish the week this past trading week. This basically identifies that investors sought little protection for their long equity exposure last week and over the last several weeks. As shown on the chart, this is an extremely low level that usually foreshadows some degree of complacency and a near term consolidation period for the broader market. We can also better review the level of complacency via the 10-day Put/Call ratio against the S&P 500 as follows:
We can see the 10-day P/C Ratio has collapsed to 0.501 – in the most extreme 1% of days in the last twenty years, and just exceeded the extreme 0.502 made at the February peak.

The Put/Call ratios noted above identify complacency, but even this doesn't pose an immediate threat to the market. Akin to the poorly positioned hedge funds in E-mini futures that were found covering in multitudes this past trading week, the Put/Call ratio isn't the best signal for gauging market trajectory near-term.
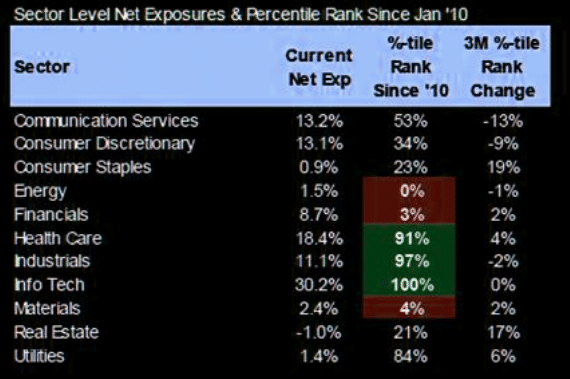
If I have concern for the market near-term it would be derived from the unforeseeable. The economy is on the mend, even as we admit that the future is less certain given the unknowns from reopening the economy with still yet a coronavirus abound and potentially spreading further in the months ahead. But this is not our greatest concern for markets. Our chief concern is centered on how highly concentrated the market is in terms of sector flows and performance. Such concentration has lead to a narrowing of market structure that proves highly beneficial when the market is trending upward, but should something shake the tops of the trees, the foundation is somewhat weak.
Information Technology, Health Care and Communication Services sectors comprise 52% of S&P market cap. The anatomy of the index is heavily skewed towards sectors that are relatively well-positioned in the current episode (and, conversely, the more traditional cyclical industries have considerably less representation in the index). If you were to fold in Amazon (AMZN), technically bucketed as a consumer stock, this chart below would be making a new high.

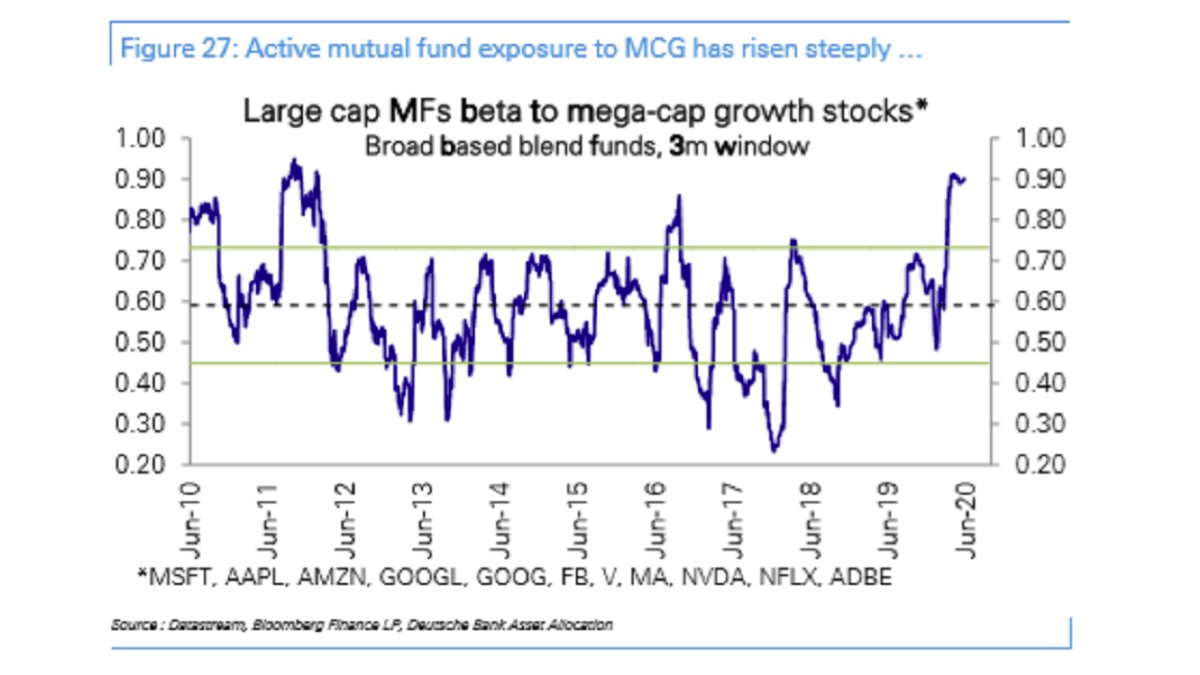
And in terms of the fund flows proving highly concentrated on these sectors: (Chart below from MacroCharts)

"Below, Equity Mutual Funds are nearly tied for the highest exposure to Mega-cap Growth Stocks in a decade. This is consistent with the massive ETF buying of Tech, Healthcare & Growth, and it seriously challenges the consensus view that this rally is “hated”. Most importantly, these Funds represent Trillions of Dollars in managed Assets, far bigger than the Hedge Fund/CTA cohorts."
Nobody appreciates a bull market more than the bulls, but in order to appreciate one fully we must be willing to recognize the pros and the cons. The cons are likely the extremely concentrated exposure and relative complacent positioning indicated within the context of our weekend notes. In order for these cons to prove more meaningful and result in an adverse reaction from the market's current trend, a catalyst may be needed.
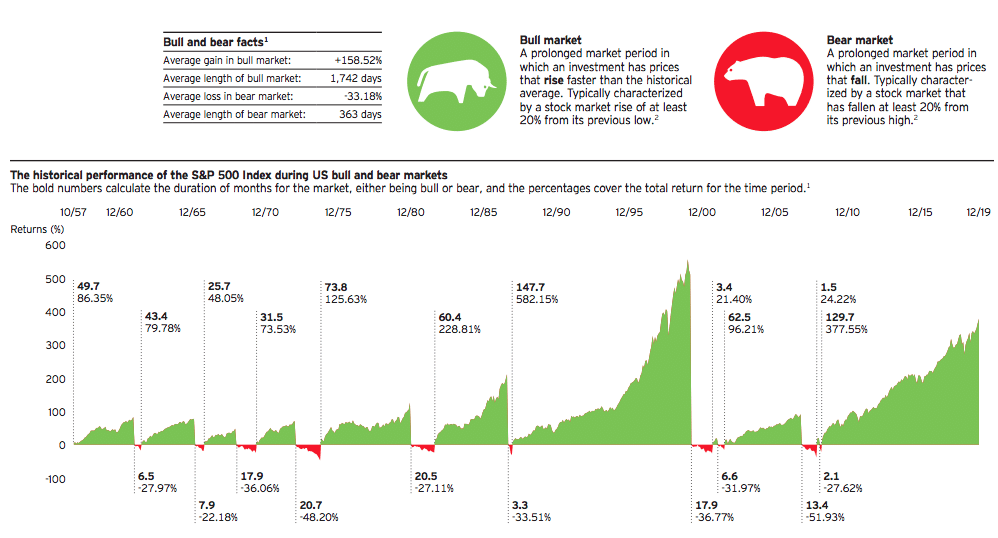
The pros are the opportunities, should a corrective phase take shape near-term, as a new bull market has been validated. There will be a bevy of reasons put forth and headlines sensationalizing any serious move lower in the markets by the media, none of which should deter the investor's focus on the bottom line; a new bull market has arrived. AND BULL MARKETS LAST A HECK OF A LOT LONGER THAN BEAR MARKETS AND DELIVER RETURNS IN MULTIPLES OF BEAR MARKETS!!
Nonetheless, some of the macro-economic things to consider near-term and even as we edge closer to the election period are offered by DataTrek as follows. Keep in mind these are some devil's advocate considerations and usually, the best-laid fears do not come to fruition.
#1: Unemployment and Labor Force Participation. History says that U.S. unemployment peaks at “X” during recession and then consistently improves thereafter. But the dislocations in this recession are focused in several areas (e.g. hospitality, retail) that employ many lower-skilled workers with fewer cross-disciplinary job skills.
#2: Holiday consumer spending. No doubt Holiday 2020 will be far weaker than 2019 but by how much? And will this reduce seasonal hiring needs dramatically and further hurt any labor market recovery?
#3: US Election results, both for the White House and both chambers of Congress. President Trump has been slipping in the polls of late, and now the Senate may be up for grabs. Are markets discounting higher corporate taxes in 2021? They probably should be …
#4: US-China relations in the wake of the 2020 Presidential election cycle. Neither political party has any interest in repairing America’s relationship with China until 2021. While the Chinese leadership knows that, they also have their own base to address and cannot seem weak when criticized by U.S. politicians.
#5: The severity of any COVID – 19-second wave. Peak flu season starts in December in North America. Will Americans want to shop or entertain if the virus is once again a national point of concern?
#6: The possibility of negative Fed Funds rates in 2021. This is one story we wish would just go away, but the Futures market won’t let it go.
#7: The strength/weakness of the dollar. The greenback has weakened a lot in the last month (-4%) on hopes for a global economic recovery. With that, it is still closer to a 3-year high than low.
#8: The extent of a U.S. corporate earnings rebound in 2021. As we’ve outlined recently, the S&P is discounting a 20% increase in earnings next year. That’s what happens in a typical recovery, but nothing seems typical about the current recession (see Point #1).
#9: The pace of economic expansion outside the US. Almost 40% of S&P 500 profits come from outside the US. Rest-of-world economies have to be growing again to get the 20% earnings growth.
#10: The effect of disruptive technologies like automation on structural unemployment and their potentially accelerating impact on old-line companies. This is the issue we think about most. The COVID Crisis sped up a decade’s worth of change on things like work-from-home and online shopping into 90 days. We’ve seen the first-order effects, but we don’t yet know the second or third-order impacts, let alone how much capital-for-labor substitution will occur in the next 6-12 months.
This past week's Nonfarm Payrolls proved to squeeze short interest with a breadth thrust to the upside. The U.S. regained 2.5 million jobs in May and the unemployment rate fell to 13.3%, confounding Wall Street expectations for another big wave of layoffs and signaling the economy began to revive last month from the worst economic crisis since the Great Depression of the 1930s.
When the U.S. government’s official jobs report for May came out on Friday, it included a note at the bottom saying there had been a major “error” indicating that the unemployment rate likely should be higher than the widely reported 13.3 percent rate.
The special note said that if this “misclassification error” had not occurred, the “overall unemployment rate would have been about 3 percentage points higher than reported,” meaning the unemployment rate would be about 16.3 percent for May. But that would still be an improvement from an unemployment rate of about 19.7 percent for April, applying the same standards.
“BLS and the Census Bureau are investigating why this misclassification error continues to occur and are taking additional steps to address the issue,” said a note at the bottom of the Bureau of Labor Statistics report.
Economists say the BLS was trying to be as transparent as possible about how hard it is to collect real-time data during a pandemic. The BLS admitted that some people who should have been classified as “temporarily unemployed” during the shutdown were instead misclassified as employed but “absent” from work for “other reasons.”
As the whole of 2020 thus far has been, this coming week will likely prove no less interesting than this past trading week. Market breadth has been very strong and most every study of historic data suggests the market will continue higher over the next 12 months, even though temporary pullbacks are likely to accompany the long-term trajectory. Much of what we're seeing in the here and now reminds us of the V-shaped bottomed in 2009, which found a brief consolidation period after a breadth thrust and significant rally off of the, yep March 2009 lows. (chart from Chris Ciovacco)
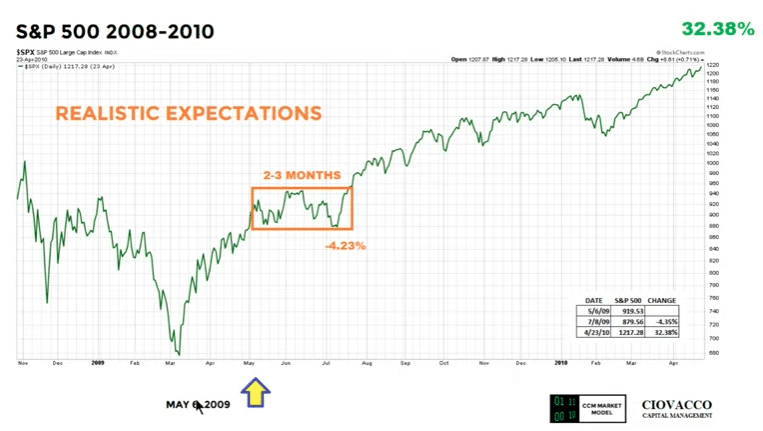
Eerily similar isn't it? Human behavior can be quite repetitive and with having learned of the opportunity that developed firstly in 2009, investors may not desire to miss out on a like opportunity developing in 2020.
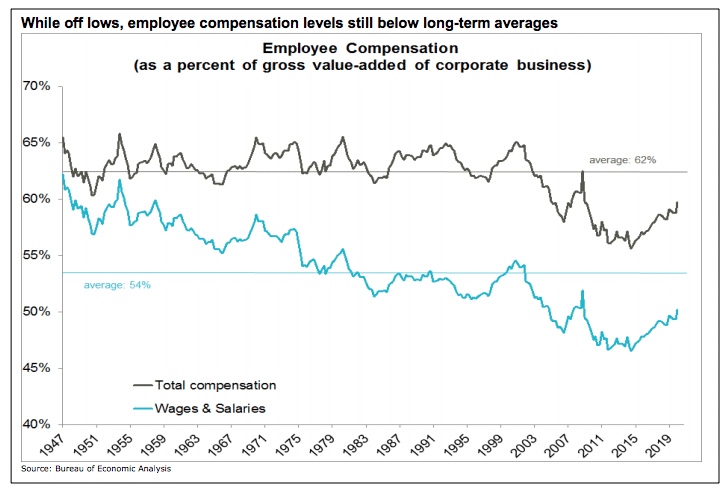
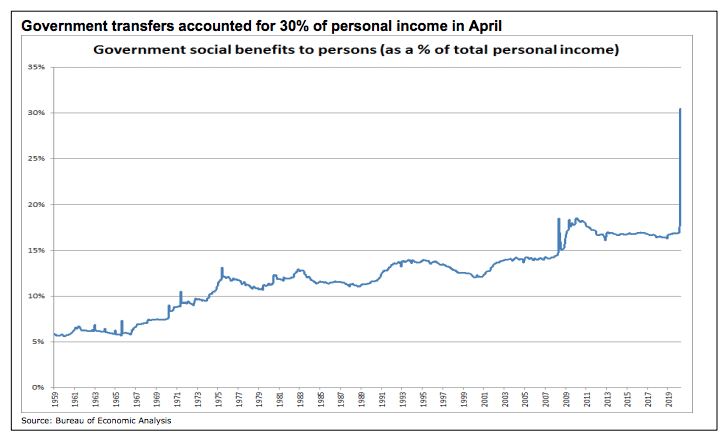
The economy and the stock market have generally moved in the same direction over time, though rarely in lock-step. The gulf between current headlines for Wall Street (best 50-day rally ever for the S&P 500) and Main Street (one-in-four American workers have now filed for jobless benefits) seems more extraordinary than normal. The stock market is famously forward-looking and some of the recent market recovery can be attributed to economic data shifting from worse than expected to better than expected even if overall levels of activity remain subdued. Sustained recovery in the economy (and continued gains in the stock market) may require a closer look at the economic trends that have been developing beneath the surface and on which recent events are casting a bright light. Corporate trends that have seen earnings per share growth outpace profit growth have benefitted shareholders but done little for employees. The employee share of corporate value-added has been below its long-term average for two decades. This has led to an increased reliance on government transfers to supplement wages. The economic weakness brought on by the fight against the coronavirus has had a disproportionate impact on younger workers, low-wage earners and minorities. This adds fuel to the unrest and tension that has produced demonstrations and protests across the country. While not looking past the current pain, the hope is that from these moments of uncertainty, a path toward a more hopeful future (and more robust economic participation) will emerge.
I recognize that it has taken a great deal of discipline and effort to recover from the bear market in 2020. Maintain your market disciplines, review your weekly/monthly game plan in accordance with our weekly notes/Reports. In order to improve as a trader/discipline, indeed it takes study and discipline. The rewards from these exercises aren't always immediate, so don't fret over the short-run and focus on the longer-term goals!
Comments
Log in or sign up to join the conversation.