

Fundamental Forecast for GBP: Neutral
BRITISH POUND TRENDS MOVE FROM FEAST TO FAMINE IN 2018
It’s been a rocky past four months for the British Pound. Coming into the month of April, the currency was flying high on the expectations of tighter policy and higher rates out of the Bank of England. This was largely in response to the rather persistent gains that had shown in inflation, with the latter portion of 2017 starting a run of five consecutive months at-or-above 3%. And while this brought upon a rate hike out of the BoE in November of last year, inflation remained strong and it appeared as though the bank would need to make further adjustments to temper price growth back towards their 2% goal.
But in mid-April, just a couple of weeks ahead of that rate decision at the BoE, evidence of falling inflation began to appear. March inflation numbers released in mid-April disappointed, coming in at 2.5%, and in short order, a reversal had started to show in GBP as markets factored in the potential for a no-hike rate decision in May. By the time the rate decision took place, GBP/USD had already fallen back to the 1.3500 area; and the dovish outlay at the meeting came as no surprise with price action just sitting on support around the 1.3500 handle in the days after the decision.
UK INFLATION FALLS BELOW 3% AND MAINTAINS SUBDUED FROM PRIOR HIGHS
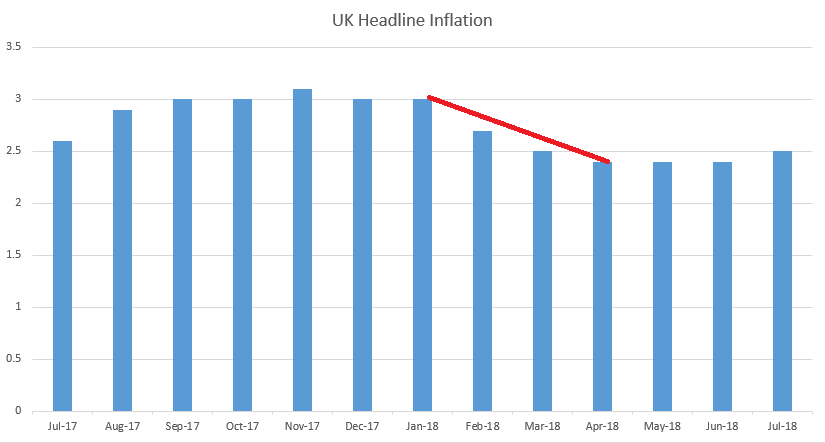
Chart prepared by James Stanley
Three months later and inflation remains subdued. This didn’t stop the BoE from hiking rates in early-August, at their next ‘Super Thursday’ rate decision; but that’s appeared to matter little to the British Pound which has spent most of that period in some form of sell-off. A fresh yearly low printed in the pair just last week. This came in from the 23.6% Fibonacci retracement of the ‘Brexit move,’ which had also produced the 78.6% retracement that helped to mark the pair’s April high.
GBP/USD WEEKLY PRICE CHART: FIBONACCI RETRACEMENT FROM BREXIT MOVE HELPS TO SET APRIL HIGHS AND AUGUST LOWS
(Click on image to enlarge)
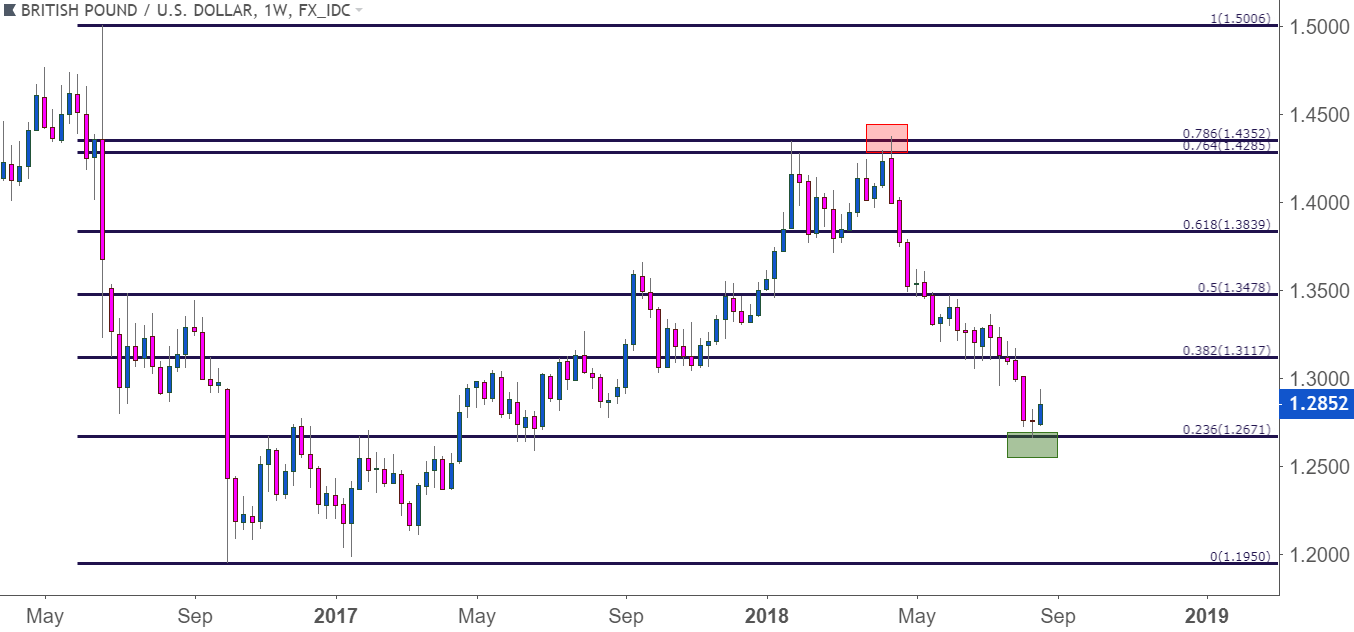
Chart prepared by James Stanley
Given the deep oversold nature of the move, combined with this long-term support level coming into play, we looked at bullish counter-trend positions as part of our FX Setups for the Week of August 20th. We looked at a first target at a prior area of resistance that we’d previously used for short-side setups, with the second target at another area of potential resistance taken from a group of swing-lows. Prices found sellers at that second area of resistance this week and soon started to move lower.
GBP/USD FOUR-HOUR PRICE CHART: FIBONACCI BOUNCE LEADS TO RESISTANCE AT PRIOR SUPPORT
(Click on image to enlarge)
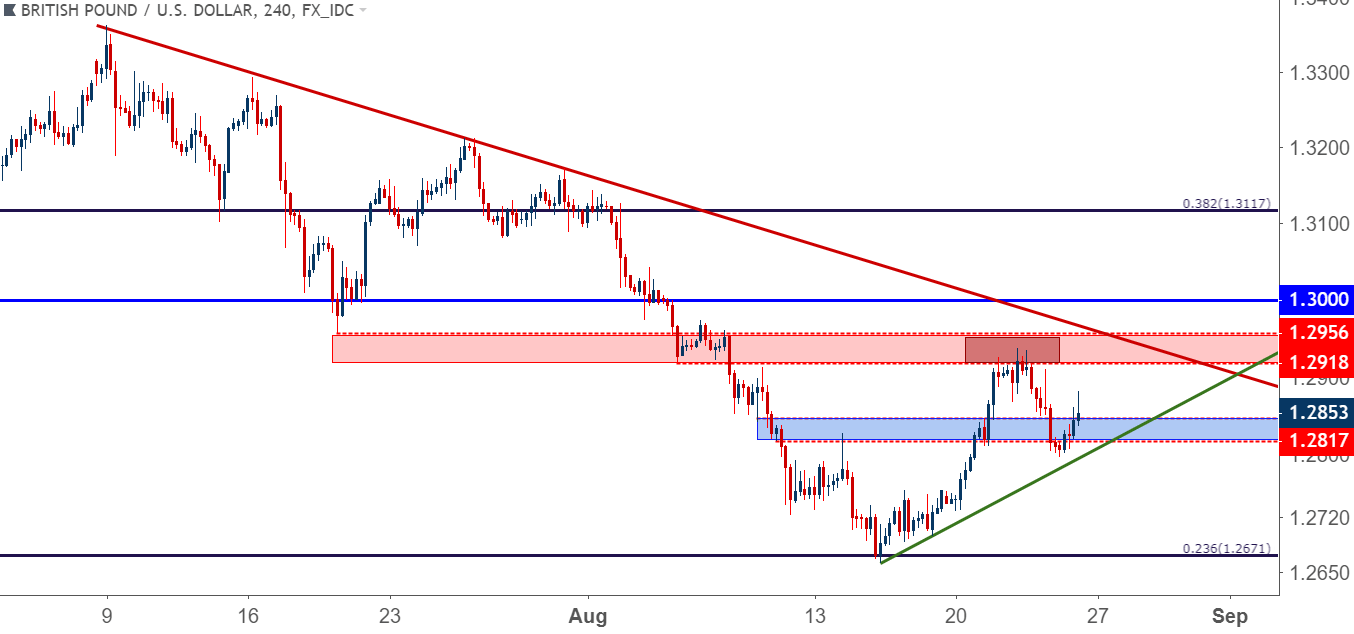
This makes the near-term backdrop in the pair fairly messy at the moment, but taking a step back shows a build of digestion after a really big move that started a little over four months ago.
GBP/USD DAILY PRICE CHART
(Click on image to enlarge)
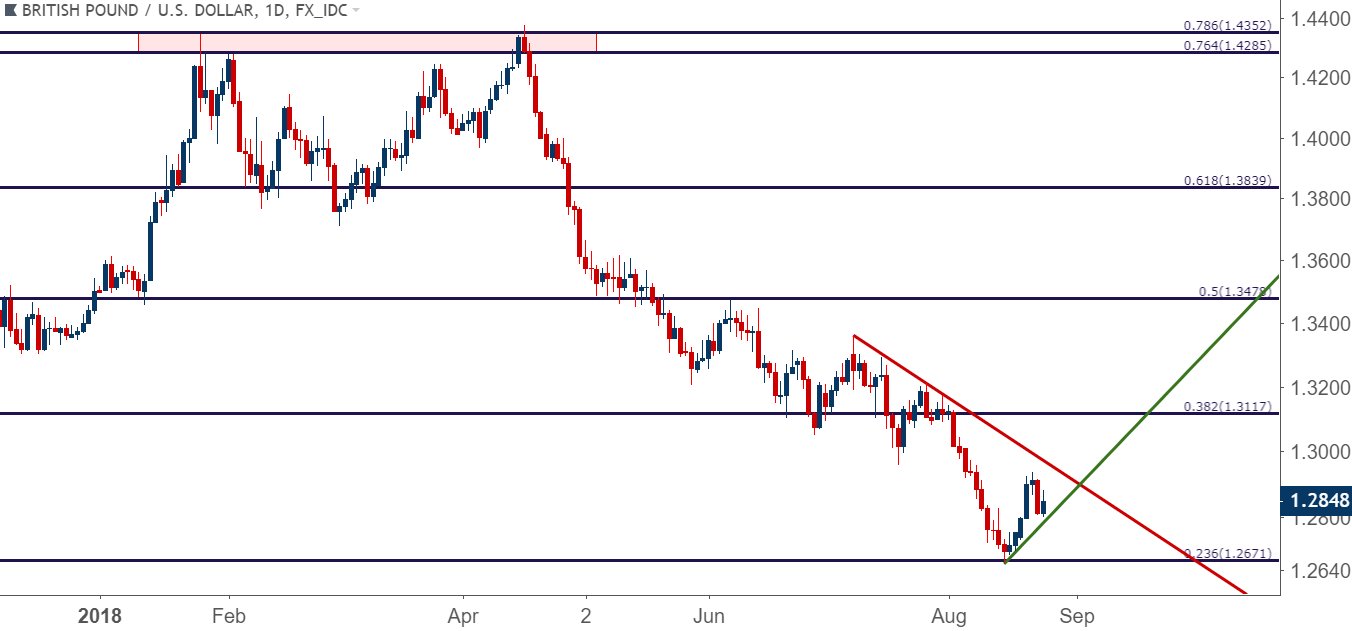
Chart prepared by James Stanley
ECONOMIC CALENDAR FOR NEXT WEEK
Next week brings a quiet economic calendar out of the UK, with no high-impact events and only a handful of medium-importance announcements. There remains a bit of vulnerability on the Brexit-front, although it appears unlikely that we’ll see any large announcements or changes or shifts on that topic until September, at the earliest.
DAILYFX ECONOMIC DOCKET: UK EVENTS FOR THE WEEK OF AUGUST 24, 2018
(Click on image to enlarge)
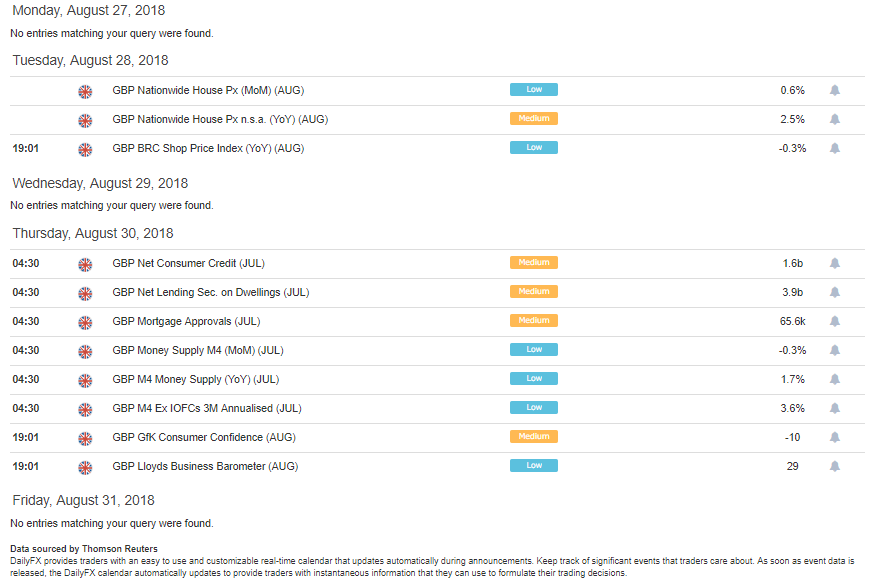
Chart prepared by James Stanley
FUNDAMENTAL OUTLOOK FOR GBP
It’s difficult to muster much by way of positivity in the British Pound right now. While we did look at bullish setups to open this week, the thesis behind those scenarios were largely based on just how oversold those moves had become. As we opined in last week’s FX Setups, this would merely be looking for price action to move up to a lower-high area of resistance; while still retaining the bearish structure in the pair.
The complication at the moment arises from the fact that this week’s bounce may not be enough to re-energize bears to the degree that fresh lows can come in. We may need a deeper retracement in order to clear out sentiment to allow for a larger, bigger-picture move.
Speaking to this – IG Client Sentiment remains net-long in GBP/USD, which is bearish given the indicator’s contrarian nature. But – the net-long position has been diminishing quickly over the past week; which highlights an increase in newly-triggered short positions in the pair, and this shows the potential for a deeper bullish move before the longer-term bearish trend is ready for resumption.
GBP/USD: IG CLIENT SENTIMENT REMAINS NET LONG, BUT LESS THAN LAST WEEK
(Click on image to enlarge)
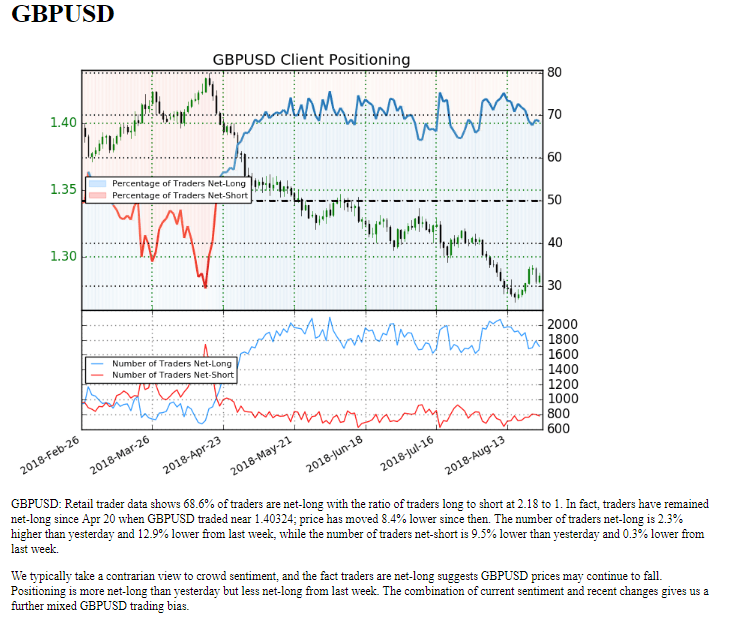
Chart prepared by James Stanley
FORECAST FOR GBP FOR NEXT WEEK
The forecast for the British Pound will be set to neutral for next week. While the bearish trend remains attractive, price proximity to the low combined with a lack nearby long-term resistance makes the prospect of continuation a challenge at current levels.



Comments
Log in or sign up to join the conversation.