
Interest rates are a key variable with a massive impact on the global economy and on financial markets. By observing price trends in different segments of the debt markets, we can learn a lot about the health of the economy and risk appetite levels among investors.
When economic growth is slowing down and risk appetite is declining, we typically see signs of declining interest rates and widening credit spreads, this can be a big red flag for stocks. Conversely, when risk appetite is rising in the bond market, this is generally a powerful tailwind for stocks and other high-risk assets.
The quantitative strategy reads the data from the bond market in order to allocate capital among stocks and bonds depending on how interest rates and credit spreads are evolving. The backtested performance data is quite strong in terms of both returns and downside risk over the long term.
As of the time of this writing, the quantitative strategy is in risk-off mode. This is mostly due to a deceleration in economic growth and declining interest rates on a global scale. Credit spreads are still reasonably contained and investors may want to keep a close eye on this massively important indicator over the coming days.
Listening To The Bond Market
The Credit Market Model is a quantitative system and it's based on managing risk exposure in the stock market by watching the main trends in the bond market.
The strategy is based on a ratio that measures the relative performance of iShares iBoxx $ High Yield Corporate Bond (HYG) versus iShares 7-10 Year Treasury Bond ETF (IEF). When this ratio is rising, it means that high-yield bonds are outperforming Treasury bonds, so risk appetite is increasing and credit spreads are falling.
The chart shows how the ratio has evolved in recent months, with the 100 days moving average as a trend indicator in black. When the ratio is above the moving average, it means that risk appetite is increasing in the bond market, sending a bullish signal for stocks. Alternatively, when the ratio is below the 100 days moving average, we are in a low-risk appetite environment, which is generally bullish for Treasury bonds and bearish for stocks.
(Click on image to enlarge)
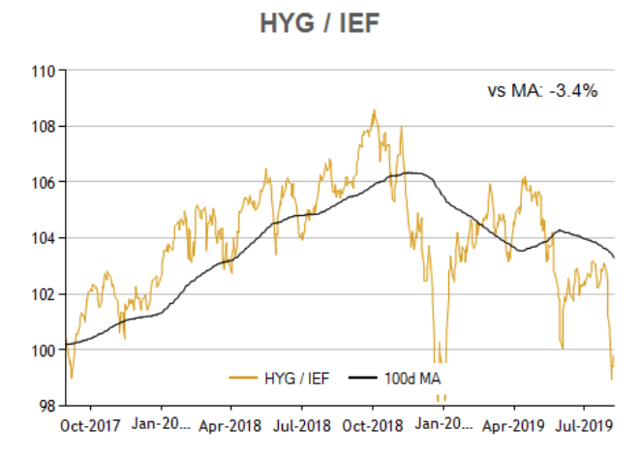
Source: ETF Replay
When the ratio is in risk-on mode, the quantitative strategy is invested in SPDR S&P 500 (SPY). On the other hand, when the ratio is below the 100-day moving average, the strategy goes for safety by investing iShares 20+ Year Treasury Bond ETF (TLT).
The quantitative strategy has substantially outperformed a buy-and-hold strategy in SPDR S&P 500 in terms of both returns and downside risk. Since 2008, the quantitative strategy gained 435.8%, far surpassing the 154.6% produced by the SPDR S&P 500 in the same period. In annual terms, the quantitative system gained 15.6% versus 8.5% for SPDR S&P 500.
(Click on image to enlarge)
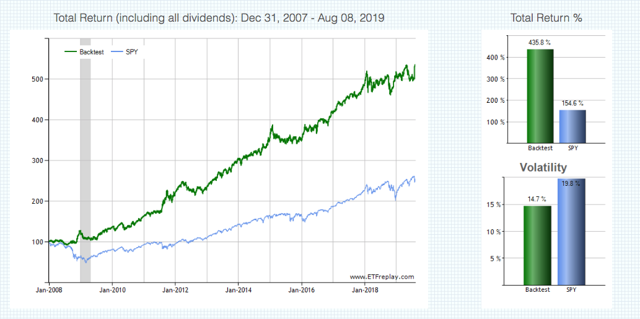
Source: ETFreplay
(Click on image to enlarge)
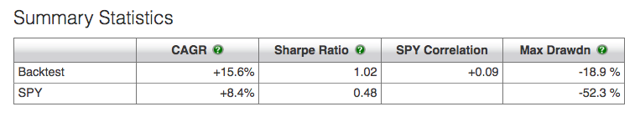
Source: ETFreplay
More importantly, the strategy does a great job in terms of risk reduction. The maximum drawdown - meaning maximum capital loss from the peak - was 18.9% for the quantitative strategy versus a maximum drawdown of 52.3% for buy and hold investors in SPDR S&P 500.
A strategy such as this one cannot be expected to outperform in each and every year. The strategy will probably do well when there are well-defined trends in risk appetite among investors. On the other hand, in periods when price trends are weak and markets are moving sideways, the strategy will most likely deliver disappointing performance.
That being acknowledged, a quantitative strategy such as this one can be quite effective at detecting the main big trends in risk appetite, and this has crucial implications for investors in stocks and bonds.
Reading The Data
The strategy has been in risk-off mode since June, as the HYG versus IEF ratio is below its 100 days moving average. When reading the data, it's important to keep in mind that the ratio is made of two different components, and we need to pay close attention to how each of those two components is behaving.
The fact that iShares 7-10 Year Treasury Bond ETF is rallying due to declining interest rates on a global is no surprise at all. With the global economy slowing down, central banks cutting rates, and investors looking for safety in the midst of the trade war, it is only reasonable to see Treasury bonds performing well in this context.
(Click on image to enlarge)
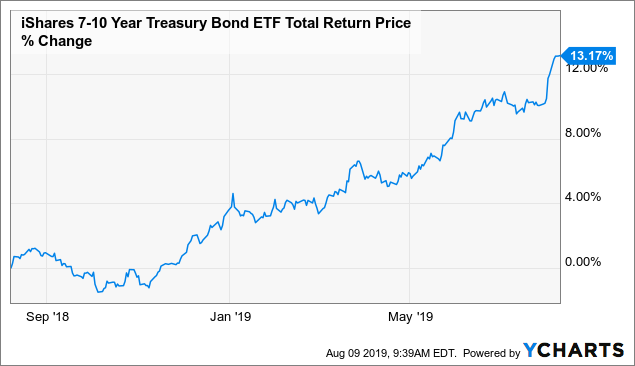
Data by YCharts
But the main variable to watch is credit spreads because this indicator is remarkably important in terms of analyzing the health of the global economy and the prospects for the stock market.
Based on the historical evidence when the stock market falls and credit spreads remain stable, this is many times a short-term dip and, ultimately, a buying opportunity. On the other hand, if credit spreads are increasing as the stock market is falling, this can signal that the situation is far more serious and concerning.
For illustrative purposes, the chart shows the evolution of the S&P 500 and high-yield credit spreads since 1999. It's easy to see how a big increase in credit spreads is generally a good indicator of tough times for the stock market.
(Click on image to enlarge)
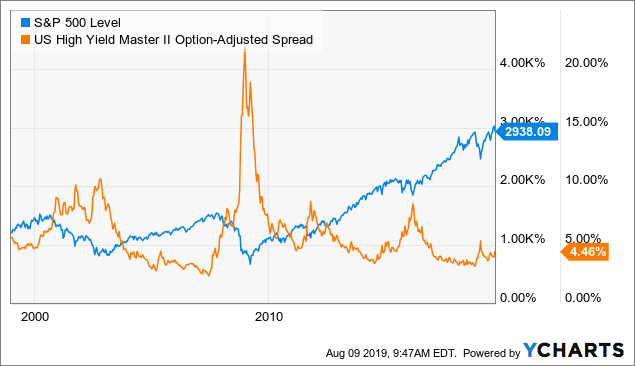
Data by YCharts
Global investors have been aggressively buying risk-free bonds recently, but they have not been selling high yield bonds, and credit spreads remain contained. In fact, when we look at HYG in isolation as opposed to in comparison to IEF, the high-yield ETF has produced solid returns for investors this year.
(Click on image to enlarge)
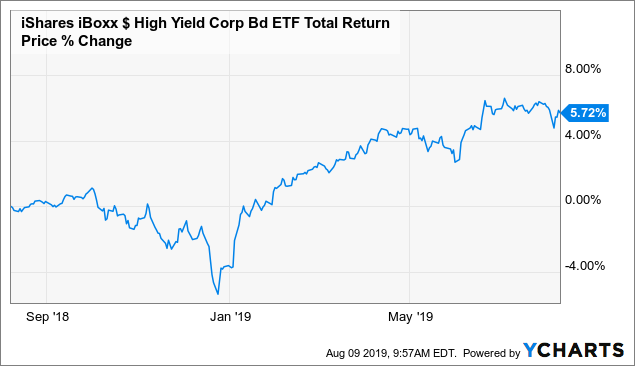
Data by YCharts
In other words, the fact that investors are aggressively buying risk-free bonds can be interpreted as a yellow flag regarding risk appetite trends. But the main game-changer is credit spreads. If - and only if - credit spreads remain low, chances are that the current correction in stocks will be relatively modest.
On the other hand, a significant increase in credit spreads would signal that things are getting much worse, so this is a crucial variable to watch closely over the coming days.


Comments
Log in or sign up to join the conversation.