

In my experience, the average guy’s thinking about the markets, inflation and volatility is completely upside down. It has resulted in irrational fears about the markets.
In the end, they are the reason he’ll never make any money.
Ironically, the most costly of these fears is the irrational fear of losing money.
I must have heard this crazy way of thinking a thousand times from new and potential clients when I was still working as a broker: “I just don’t want to lose any money.”
In my first meeting with new clients, seven out of 10 of them said exactly that. They essentially wanted to tread water with their money, thinking that would result in no losses.
Well, if you tread water for 20 years, a $1 million portfolio will lose at least 30% of its value… just to inflation.
You will have to grow that amount to $1.5 million just to stay even, which is what my clients instructed me to do.
And you can’t make $500,000 in 20 years by treading water or using the “keep what you have” thinking most people employ.
At the root of this no-loss thinking is the fact that most people are unable to distinguish between market fluctuations and established losses. That inability to see the distinction generates the irrational fear of losing money. They see any fluctuation as a negative and almost always sell – and always at a loss.
You cannot be in the market – bond or stock – if you do not understand that markets fluctuate… a lot. And only you can make that a loss by selling into that fluctuation.
That’s the part the average guy doesn’t get. Making money is about riding out the volatility and fluctuations – not selling into them.
Being unable to recognize the difference will eliminate any growth potential going forward. And in a retirement scenario, no growth is a formula for waking up broke in your 80s. (Read more on that topic here, here and here.)
Actuaries estimate we’ll spend 20 to 30 years in retirement. And if you’re going to have any degree of financial security in those years, you have to grow your money.
That means getting past this irrational fear.
In the hundreds of meetings I’ve had with small investors, they nod their heads and agree with me when I explain volatility and why you have to ignore it.
Six months into the process, though, and the slightest fluctuation in their account value… and they’re gone. Always at a loss.
It is very likely every person reading this article has seen the Ibbotson chart that shows endless years of positive growth in stock prices. Advisors used that chart for decades to show the great long-term potential of stocks and convince investors to stay in the market.
But this effort and all the others to educate and help the small investor haven’t worked, otherwise we wouldn’t see the huge selling we see at the bottom of dips.
Most of you are painfully aware of how volatile the market was in 2000 and in 2008. And let’s not forget the first quarter of this year. That chart is below.
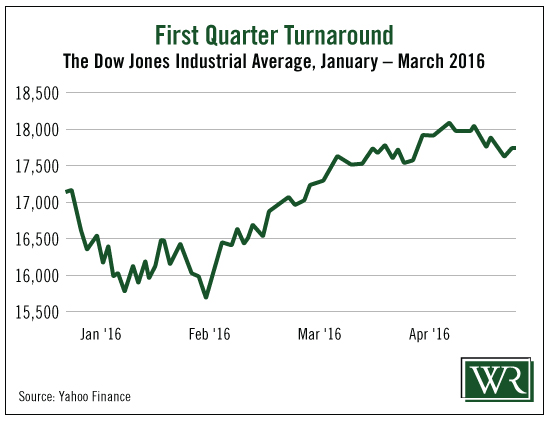
Now that’s a turnaround!
But it won’t make any difference how big or fast the turnaround is unless you ignore the fluctuations and stay the course.
And most folks can’t stay the course. They will be crushed by inflation in retirement because of it.
So here’s a new drill I’ve come up with to help you get through the fear of market swings and stay in the only place you will ever make money: your investments.
Before we go any further, remember: All of this “hold” thinking is predicated on the idea that you hold investments appropriate for people our age: large cap, dividend payers, conservative bonds, REITs, etc.
Unless you already have the cash you’ll need for a comfortable retirement, your Wild West investing days of speculation and high risk are over.
Below is the 10-year chart for the Dow Jones Industrials. As you can see, it includes the worst sell-off in most of our memories, the 2008-2009 collapse.
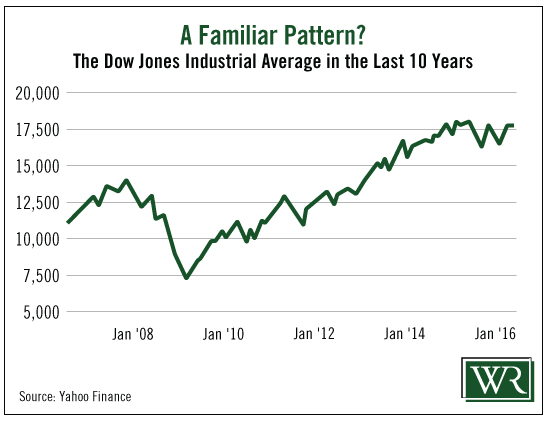
I want you to save this chart where you won’t lose it. Your desktop is probably a good place.
The next time you get that “bottom falling out of the market” feeling and the urge to sell to cut your losses, pull up this chart and put it next to the current 10-year chart for the Dow Industrials. I guarantee they will look the same.
What this comparison will show you is that the dips will be the same or smaller, and the long-term upward trend will be the same or better.
In fact, my gut tells me we are done with the horrible kind of market we had in 2008 and early 2009, at least for our lifetimes, so no matter what is going on in the future, the comparison should look better.
Believe me, we will always have crazy periods when it looks like the world is ending. But after 33 years of watching the market, I know that it isn’t the end of anything. It’s a buying opportunity.
Let the comparison of the two charts sink in, and then stop and think about how much you lost the last time you cut and ran because of identical fluctuations. Not losses, but fluctuations.
They weren’t losses until you clicked on that sell button.
We are living so much longer than any of us ever imagined, and that fact alone means we must grow whatever we have. We can’t tread water; it is financial suicide and one of the best ways I know to wake up broke in your 80s.
Save that chart where you can find it.

Comments
Log in or sign up to join the conversation.