

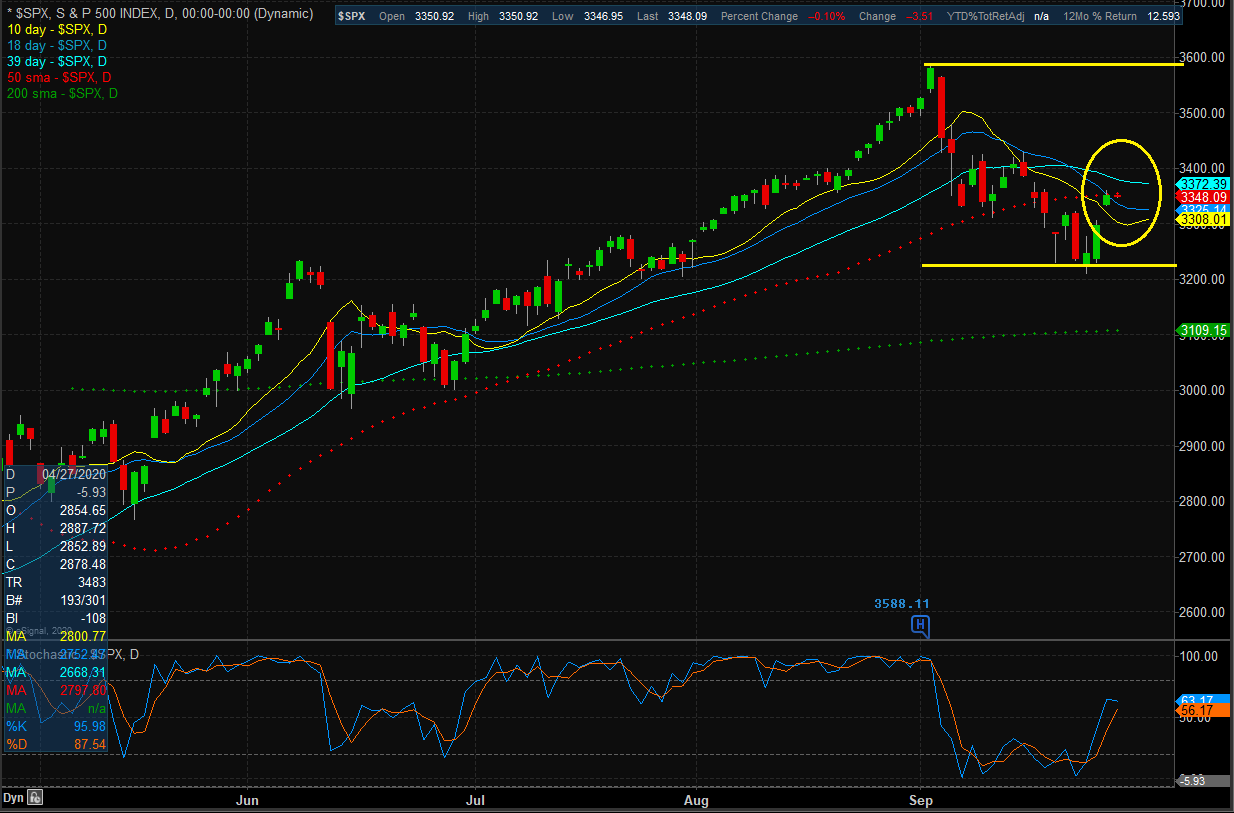
From my seat, the key to the action on the chart of the S&P 500 here is the battle for the 50-day moving average. To review, the bulls were able to make a stop at the 3225 zone on a closing basis. This was important because it kept the pullback from reaching the key -10% zone (the low point of the decline was -9.3%). From there, our heroes in horns got some help from the news flow as renewed stimulus talks gave the market hope that the additional support - support the Fed says the economy needs badly - was back on the table. So, with a stop being made, the next step for traders was to buy the dip and/or cover shorts. As such, it would appear that a trading range is developing. And with the 50-day seen by many as the key line in the sand determining which team has possession of the ball, my take is that there is a battle currently taking place - directly on the 50-day. So, if the bulls can push decidedly above 3355, my bet is the next resistance zone and perhaps even the top of the range is on the table. But if our furry friends in the bear camp prevail here, then a retest of the correction lows could be on the table. As such, I'll be watching the near-term action closely here.
The State of the Trend Indicators
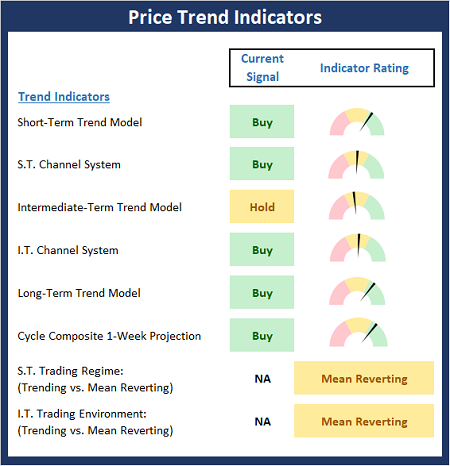
As the saying goes, what a difference a day makes. Or in this case a week. Last week, the Trend Board was in trouble with only one buy signal on the board. This week, all of the models are green, save one. Granted, the readings of the component models are less than robust. But the bottom line is the models perked up enough to move from red to green. So, for now at least, the Trend board suggests the advantage goes to the bulls. Fingers crossed.
(Click on image to enlarge)
* Source: Ned Davis Research (NDR) as of the date of publication. Historical returns are hypothetical average annual performances calculated by NDR. Past performances do not guarantee future results or profitability - NOT INDIVIDUAL INVESTMENT ADVICE.
About The Trend Board Indicators: The models/indicators on the Trend Board are designed to determine the overall technical health of the current stock market trend in terms of the short- and intermediate-term time frames.
My Take on the State of the Charts...
I largely summarized the state of the chart action in my executive summary above. In short, it looks to me as if the bulls and bears are duking it out over the S&P's 50-day moving average and the winner will likely run with the ball for a while. If the bulls can breakthrough, the next resistance zone is around 3420ish. And if the bears take control, the low of the recent decline would represent the next battleground. For now, I don't think either team has a distinct advantage, so the winner of this little tussle will likely control the next move.
S&P 500 - Daily
(Click on image to enlarge)
Next, let's check in on the state of the market's internal momentum indicators.
(Click on image to enlarge)
* Source: Ned Davis Research (NDR) as of the date of publication. Historical returns are hypothetical average annual performances calculated by NDR. Past performances do not guarantee future results or profitability - NOT INDIVIDUAL INVESTMENT ADVICE.
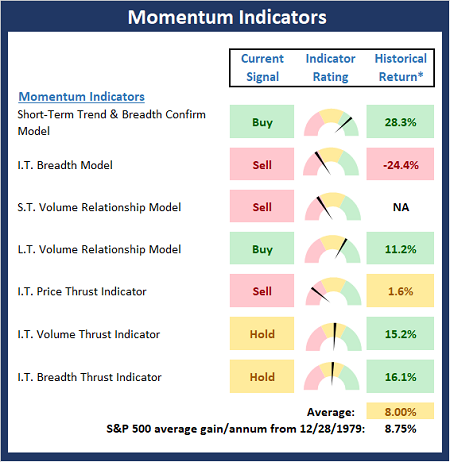
I mentioned above that I didn't think either team had a real edge here. Exhibit A for my argument is the state of the Momentum board. If the bulls had really turned things around and were ready to make a run, I would expect to see a lot more green here. The good news is that there are now 2 buy signals on the board - up from 1 last week. The bad news is there are only 2 buy signals on the board. The bottom line is I'd like to see some additional improvement in the momentum indicators before I can declare the corrective phase over. For now, the bulls have the ball. But they need to put a drive together because a "3 and out" here could easily return the momentum to the bear sideline.



Comments
Log in or sign up to join the conversation.