
For those of you who want to know which stocks are having great momentum, this list is for you. I used Barchart to sort the S&P 400 Mid Cap Stock Index stock to find the stocks with the most frequent up days in the last month. The list includes Teledyne Technologies (NYSE:TDY),Oceaneering International (NYSE:OII), Dean Foods (NYSE:DF) , SM Energy (NYSE:SM) and Helix Energy Solutions (NYSE:HLX):
Teledyne Technologies
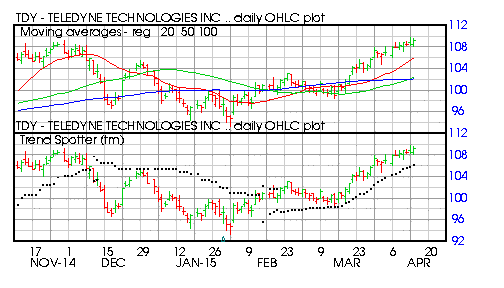
Barchart technical indicators:
- 96% Barchart technical buy signals
- Trend Spotter buy signal
- Above its 20, 50 and 100 day moving averages
- 16 new highs and up 10.26% in the last month
- Relative Strength Index 72.40%
- Barchart computes a technical support level at 107.31
- Recently trade at 109.24 with a 50 day moving average of 102.37
Oceaneering International
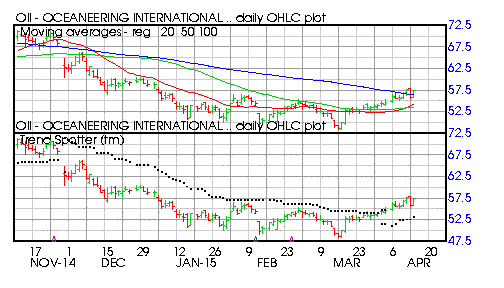
Barchart technical indicators:
- 64% Barchart technical buy signals
- Trend Spotter buy signal
- Above its 20, 50 and 100 day moving averages
- 15 new highs and up 16.38% in the last month
- Relative Strength Index 64.41%
- Barchart computes a technical support level at 54.10
- Recently traded at 57.35 with a 50 day moving average of 53.57
Dean Foods
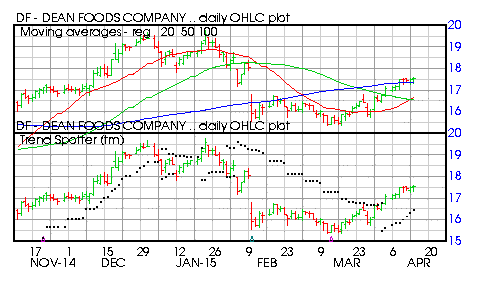
Barchart technical indicators:
- 56% Barchart technical buy signals
- Trend Spotter buy signal
- Above its 20, 50 and 100 day moving averages
- 15 new highs and up 12.52% in the last month
- Relative Strength Index 65.79%
- Barchart computes a technical support level at 17.18
- Recently traded at 17.53 with a 50 day moving average of 16.55
SM Energy
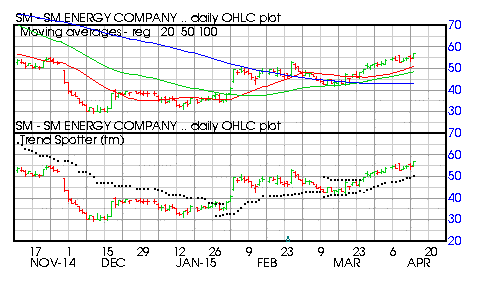
Barchart technical indicators:
- 96% Barchart technical buy signals
- Trend Spotter buy signal
- Above its 20, 50 and 100 day moving averages
- 14 new highs and up 30.95% in the last month
- Relative Strength Index 68.91%
- Barchart computes a technical support level at 52.11
- Recently traded at 16.44 with a 50 day moving average of 15.89
Helix Energy Solutions
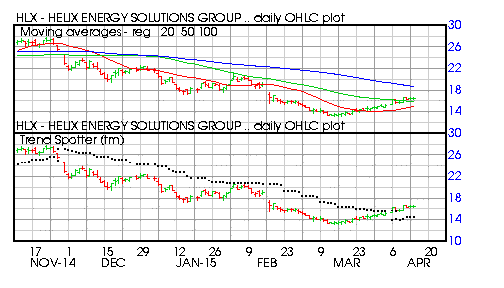
Barchart technical indicators:
- 24% Barchart technical buy signals
- Trend Spotter buy signal
- Above its 20, and 50 day moving averages
- 14 new highs and up 21.66% in the last month
- Relative Strength Index 62.53%
- Barchart computes a technical support level at 16.09
- Recently traded at 16.44 with a 50 day moving average of 15.89


Comments
Log in or sign up to join the conversation.