

The four stages: what they are and where they come from
Every traded asset moves through four phases, and knowing which one it is in tells you a lot about what to do. That is the idea behind Stan Weinstein's stage analysis, laid out in his 1988 book Secrets for Profiting in Bull and Bear Markets. Weinstein watched a stock's price against its 30-week moving average and named four stages:
Stage 1, basing: after a decline, the price goes sideways around a flattening average while sellers run out.
Stage 2, advancing: the price breaks out above a rising average and keeps making higher highs. This is the stage he wanted to own.
Stage 3, topping: the advance stalls, the price churns around the average, and the average rolls over.
Stage 4, declining: the price falls below a falling average. This is the stage he wanted to avoid or sell short.
His rule of thumb was simple: buy when a stock moves from Stage 1 into Stage 2, hold while it stays there, and get out before Stage 4 does the damage.
How I use them here
Weinstein read his stages by eye, judging the shape of the base or the top. To back-test them I need a definition a computer can apply the same way every day, so I use two tests: is the close above or below the 200-day moving average (about 40 weeks, a little slower than his 30), and the slope of that average.
In this version, Stage 1 is a close below a rising average, Stage 2 a close above a rising average, Stage 3 a close above a falling average, and Stage 4 a close below a falling average.
One difference matters for this article. In Weinstein's version, Stage 1 comes after a decline. In this mechanical version, any close below a still-rising average counts as Stage 1, so it also catches the first days of a pullback inside an uptrend, before anyone knows whether it is a dip or the start of a top. Since 1928 the Dow has spent about 60% of its trading days in Stage 2, 24% in Stage 4, and about 8% each in Stages 1 and 3. Stage 1 is the rarest and the most ambiguous: a pullback in an uptrend and the start of a bear market look exactly alike there.
The stages are not a trading signal on their own. Here they work as a filter for one: my dip buys, the CIT Oscillator crossing back up from oversold, are taken only when the asset is in Stage 2.
Why it matters this month
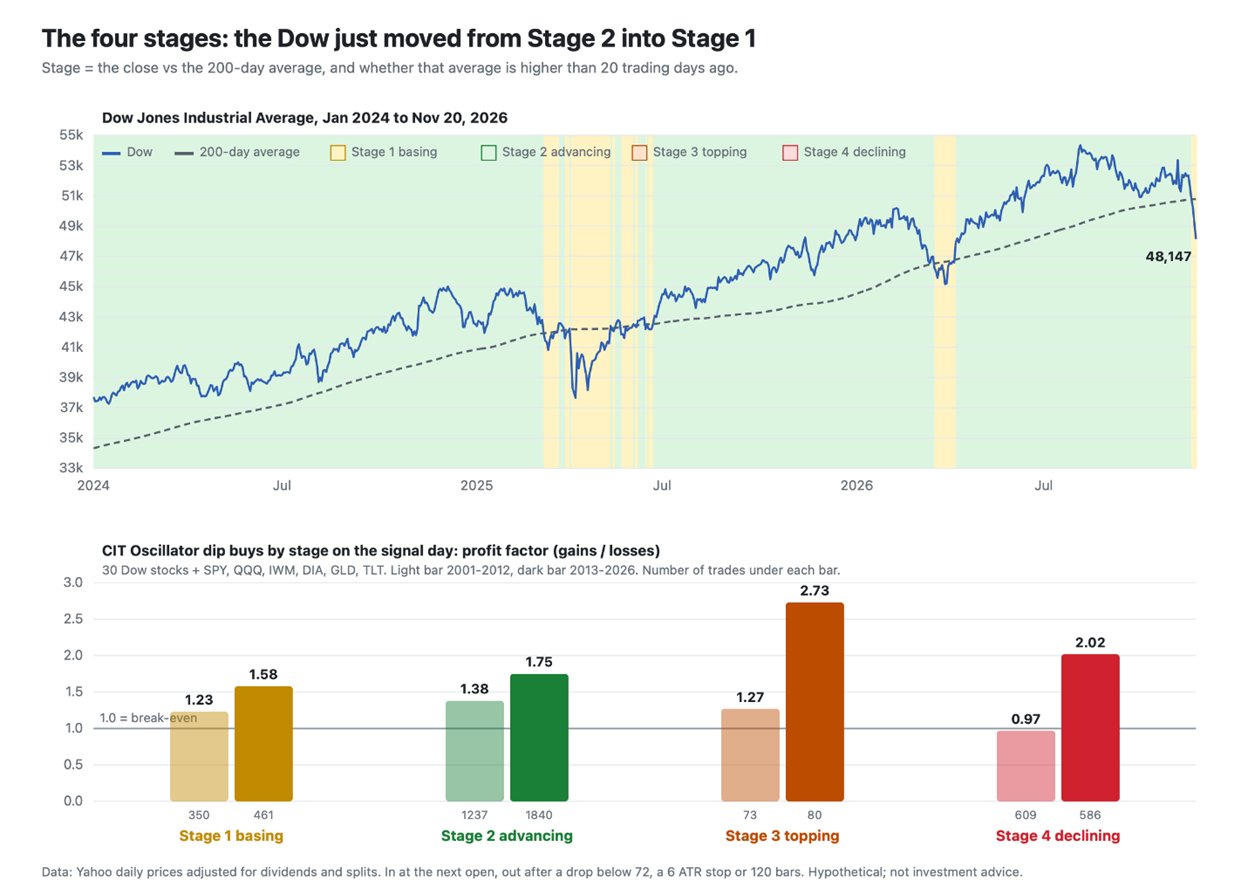
This month the Dow, the S&P 500, the Nasdaq 100 and the Russell 2000 all slipped out of Stage 2 and into Stage 1. The Dow closed Friday at 48,147, 5.2% below its 200-day average of 50,776, but that average is still rising. So the practical question is whether this is a dip to buy or a time to wait.
My rules wait. The rest of this article lays out why, in five steps: what each stage has done for the Dow since 1928, how oversold buys fared in each stage across 36 assets since 2001, how long the Dow has stayed below its 200-day average once it breaks, whether heavy NYSE selling changes the picture, and how to hold on to more of a Stage 2 advance than a short dip trade captures.
What each stage has done on its own
Start with the plain record: the Dow's average return over the next 20, 60 and 250 trading days from every day in each stage. The figure in brackets is the share of times the Dow was higher.
Dow, 1928-2026 | Next 20 days | Next 60 days | Next 250 days |
Stage 1 basing | +0.71% (61%) | +1.90% (61%) | +5.33% (70%) |
Stage 2 advancing | +0.71% (62%) | +2.08% (65%) | +7.78% (70%) |
Stage 3 topping | +0.16% (57%) | +1.87% (66%) | +10.75% (72%) |
Stage 4 declining | +0.36% (55%) | +0.90% (56%) | +6.85% (66%) |
Stage 4 has been the weakest over the following one to three months, as you'd expect. Stage 1 is the interesting one, because it has changed character. Since 1976, a Dow in Stage 1 rose an average of 3.62% over the next 60 days and was higher 76% of the time, the best of any stage. From 1928 to 1975 the same setup averaged +0.07% and was higher only 46% of the time, the worst. A dip below a still-rising average has been a gift in the modern era and a trap in the 1930s and early 1970s.
Dip buys by stage
A trader's question is narrower: when an oversold signal fires, does the stage matter? I ran every CIT Oscillator buy (a cross back up through 25) on the 30 Dow stocks plus SPY, QQQ, IWM, DIA, GLD and TLT from 2001 to November 2026, with no filter except the stage on the signal day. Each trade was entered at the next open and closed when the oscillator dropped back below 75. Prices are adjusted for dividends and splits.
Stage on the signal day | Trades | Winners | Average trade | Profit factor | Trades losing 10%+ |
Stage 1 basing | 811 | 67.2% | +0.81% | 1.41 | 7.3% |
Stage 2 advancing | 3,077 | 69.7% | +0.95% | 1.58 | 5.8% |
Stage 3 topping | 153 | 72.5% | +1.52% | 1.76 | 9.2% |
Stage 4 declining | 1,195 | 64.9% | +0.74% | 1.28 | 10.0% |
Splitting the record into two eras, as in the lower half of the chart, tells more than the totals:
Stage 2 was solid in both: a profit factor of 1.38 in 2001-2012 and 1.75 in 2013-2026, with the fewest large losses.
Stage 4 flipped: it lost money in 2001-2012 (profit factor 0.97, with 14% of trades losing 10% or more), then did well in the V-shaped markets since 2013 (2.02). A filter can't count on the next bear market being V-shaped.
Stage 1 worked, but less well than Stage 2 in both eras: 1.23 and 1.58, with more large losses.
· Stage 3 looks best but is thin: 153 trades across 36 assets in 25 years, most of the result from 2013-2026. That is too few to build a rule on.
Why the rules buy only in Stage 2
Stage 2 isn't chosen for having the single best number in a table. It's chosen because it is where most dip buys happen, it held up in every period I tested, and it keeps you out of the stretches that do real damage.
The long Dow test shows how. Running the full rules on the Dow from 1928 to 2026, requiring Stage 2 raised the profit factor from 1.46 to 1.76, and nearly all of that difference came from 1929-1945. Buying oversold dips during the 1929-1932 collapse lost money without the filter (profit factor 0.72) and made money with it (2.34). In most other eras the results with and without the filter were close. On the ETFs since 2005, dropping the filter added about 15% more trades with similar results.
So the filter works like insurance: it costs a few trades in normal markets and pays off in the rare long bear market. Stage 1 is where that trade-off is decided, because every Stage 4 decline from an uptrend starts as a Stage 1 dip. That makes the next question the important one: once the Dow breaks below its 200-day average, how long does it usually stay there?
Days below the 200-day average: most breaks are brief, but some aren't
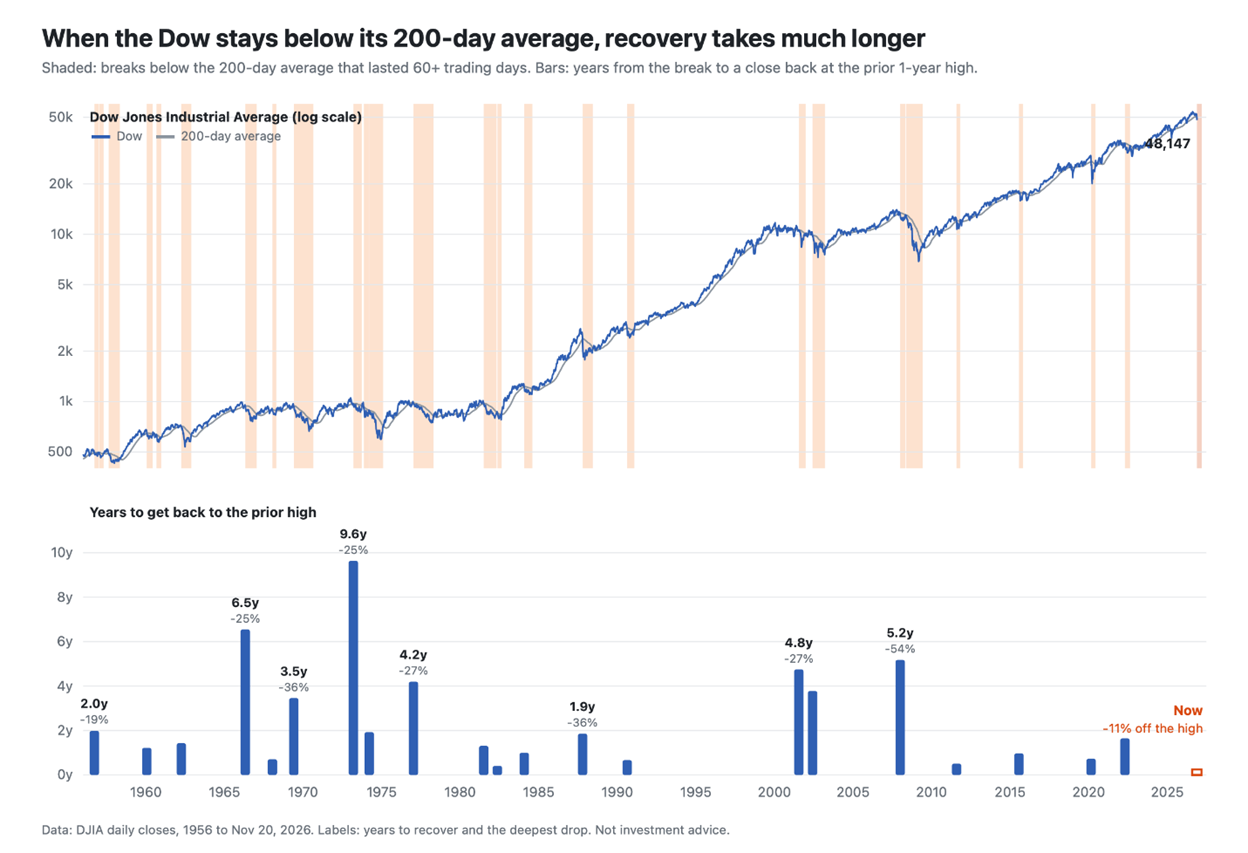
Next, I looked at how long a break below the 200 dma lasted. And the answer is that most breaks don’t last. The median break lasted three trading days, and four out of five were over within a month. On its own, a close below the 200-day average has said very little, which is why Stage 1 dips have usually been good buys since 1976.
Back above the line is not the same as recovered
A tougher test is how long the Dow took to close back at its high of the 12 months before the break. Across all 250 breaks the median was about 166 trading days, roughly eight months.
The picture changes once a break lasts. Twenty-six breaks kept the Dow below its 200-day average for 60 trading days or more, and for those the median wait to regain the prior high was about 420 trading days, or 1.7 years.
What stands out
Fast recoveries are common even among the long breaks. Seven of the 21 episodes regained the prior high within about a year: 1968, 1982, 1984, 1990, 2011, 2015 and 2020.
The depth of the drop doesn't decide the wait. The 2020 crash fell 37% and was back in eight months; the 1977 break fell 27% and took 4.2 years.
The long waits cluster in two eras. The 1966-1982 stretch of inflation and high rates and the 2000-2013 stretch of the dot-com bust and the financial crisis account for every recovery longer than 3.5 years. Outside those eras, no break took more than two years.
On the first day of a break there is no way to tell which kind it will be. Stage 2 rules don't try to guess. They wait for a close back above a rising average, which means missing the early part of some quick recoveries in exchange for never averaging down into the 1929, 1973 or 2008 kind of break.
Does heavy selling change the picture?
There may be one exception worth knowing. Does a burst of heavy NYSE selling make a dip buy worth taking outside Stage 2? The evidence shows that a single heavy-selling day says little outside Stage 2. In Stage 2 it was followed by gains 73% of the time; in Stages 1 and 4 it was a coin flip.
A cluster of heavy-selling days is different. It was followed by above-average gains in every stage, which looks more like capitulation than trend. In Stage 1, SPY was higher five days later in 16 of 17 cases. In Stage 4 the bounce came only after the deepest dips (an average worst low of -7.1% within 20 days).
A cluster turned Stage 4 dip buys from losers into winners. Oscillator buys in Stage 4 averaged -0.50% over 20 days. The 21 that came within 10 days of a selling cluster averaged +2.12%, and +6.23% over 60 days. The improvement held in both 2001-2013 and 2014-2026.
The samples are small, so I treat this as a possible exception, not a new rule: heavy, repeated selling is the one condition where buying below the 200-day average has held up. Without it, Stage 2 remains the place to buy dips.
Beyond the short trade: riding the whole Stage 2
The dip buys above are short trades, about two to three weeks from the oversold signal back to the top of the range. A Stage 2 advance often lasts a year or more, so the natural follow-up is how to stay in for more of it. I tested several entries and exits on the same 36 assets from 2001 to 2026.
Together the tests suggest a two-part plan for Stage 2. The core position goes on early in a new Stage 2, on the fifth straight Stage 2 day or the first oscillator buy, and is held until Stage 4. Every later oscillator buy is a separate short-term trade, closed when the oscillator falls back below 75, rather than an addition to the core.
Where the market stands now
All four moved straight from Stage 2 into Stage 1 this month: QQQ and IWM on November 13, the Dow on November 17 and SPY on November 19. The Dow's break is four trading days old, in the range where 56% of breaks since 1956 have ended. Duration is the thing to watch, more than depth: if the Dow is still below its average by mid-February 2027, about 60 trading days in, it would join the group where recoveries took years rather than months. Before that, two levels decide what comes next:
Back to Stage 2: a close back above the 200-day average, now about 50,776. Dip-buy signals would count again from there.
On to Stage 4: the average itself turning down. The closes now dropping out of the 200-day window, from February and early March, were mostly between 47,500 and 50,200. If the Dow simply stayed near 48,150, the average would fall below its level of 20 days earlier in about 11 trading days, in early December. That would make it Stage 4, the stage where dip buys lost money in 2001-2012 and where the Dow's next three months have been weakest.
The selling side is already notable. NYSE down volume was 80% on November 12, 78% on November 16 and 79% on November 17, which completed a selling cluster while SPY was still in Stage 2. On November 19, the day SPY slipped into Stage 1, 86% of NYSE volume was in declining stocks. Clusters in Stage 1 have had some of the better follow-throughs in the record, but with 17 cases since 2001 that is a tendency, not a forecast.
Until the Dow closes back above a rising 200-day average, it is in Stage 1. Oversold signals are worth watching there but, under strict rules, not buying.

Comments
Log in or sign up to join the conversation.