

Quick answer: Before the 2026 U.S. midterms, Elliott Wave Forecast mapped possible paths for EURUSD, Dow futures, Russell 2000 futures and AMD. Follow-up charts show the projected sequence across several sessions, although turning levels differed. The examples show how a pre-event roadmap can frame price action, not prove what caused it.
Key question: When election headlines arrived, how did price compare with the roadmaps already on the charts?
Key Takeaways
EURUSD dipped toward 1.1100 and rebounded into the 1.12649 equal-leg area.
Dow futures pulled back more deeply than sketched, rallied above 53,735 and then reversed.
Russell 2000 futures turned near 2,890, around 50 points short of the roughly 2,940 projection.
AMD rebounded above the original sketch before falling to approximately $403.06 on the November 5 update.
These selected examples show different degrees of alignment with the original paths. No chart guarantees a reaction.
What Happened Around the Midterms?
The U.S. midterm elections took place on November 3, 2026. As traders watched the results, several markets were already moving through structures our analysts had mapped.
The EURUSD and Dow futures charts were timestamped October 27 and October 29. The AMD chart was dated November 2, and the Russell chart was updated at 00:30 GMT on November 3, before U.S. polls opened. The follow-ups run from November 4 to November 11. They show moves over multiple sessions, not just election night.
Election news can influence markets, but these charts cannot isolate its effect from other drivers or establish that the election caused each move. What they do provide is a way to compare a roadmap with the price action that followed.
EURUSD: The Dip and Rebound
On October 27, EURUSD was near 1.11292. Our four-hour chart sketched one more dip toward 1.1100 to complete wave ((b)), followed by a corrective rally in wave ((c)). The broader bearish count carried an invalidation level of 1.17143.
The first chart treated that potential bounce as part of a larger correction. Rather than assuming the existing decline would continue without interruption, the roadmap allowed room for a recovery before the broader bearish view could be tested again.
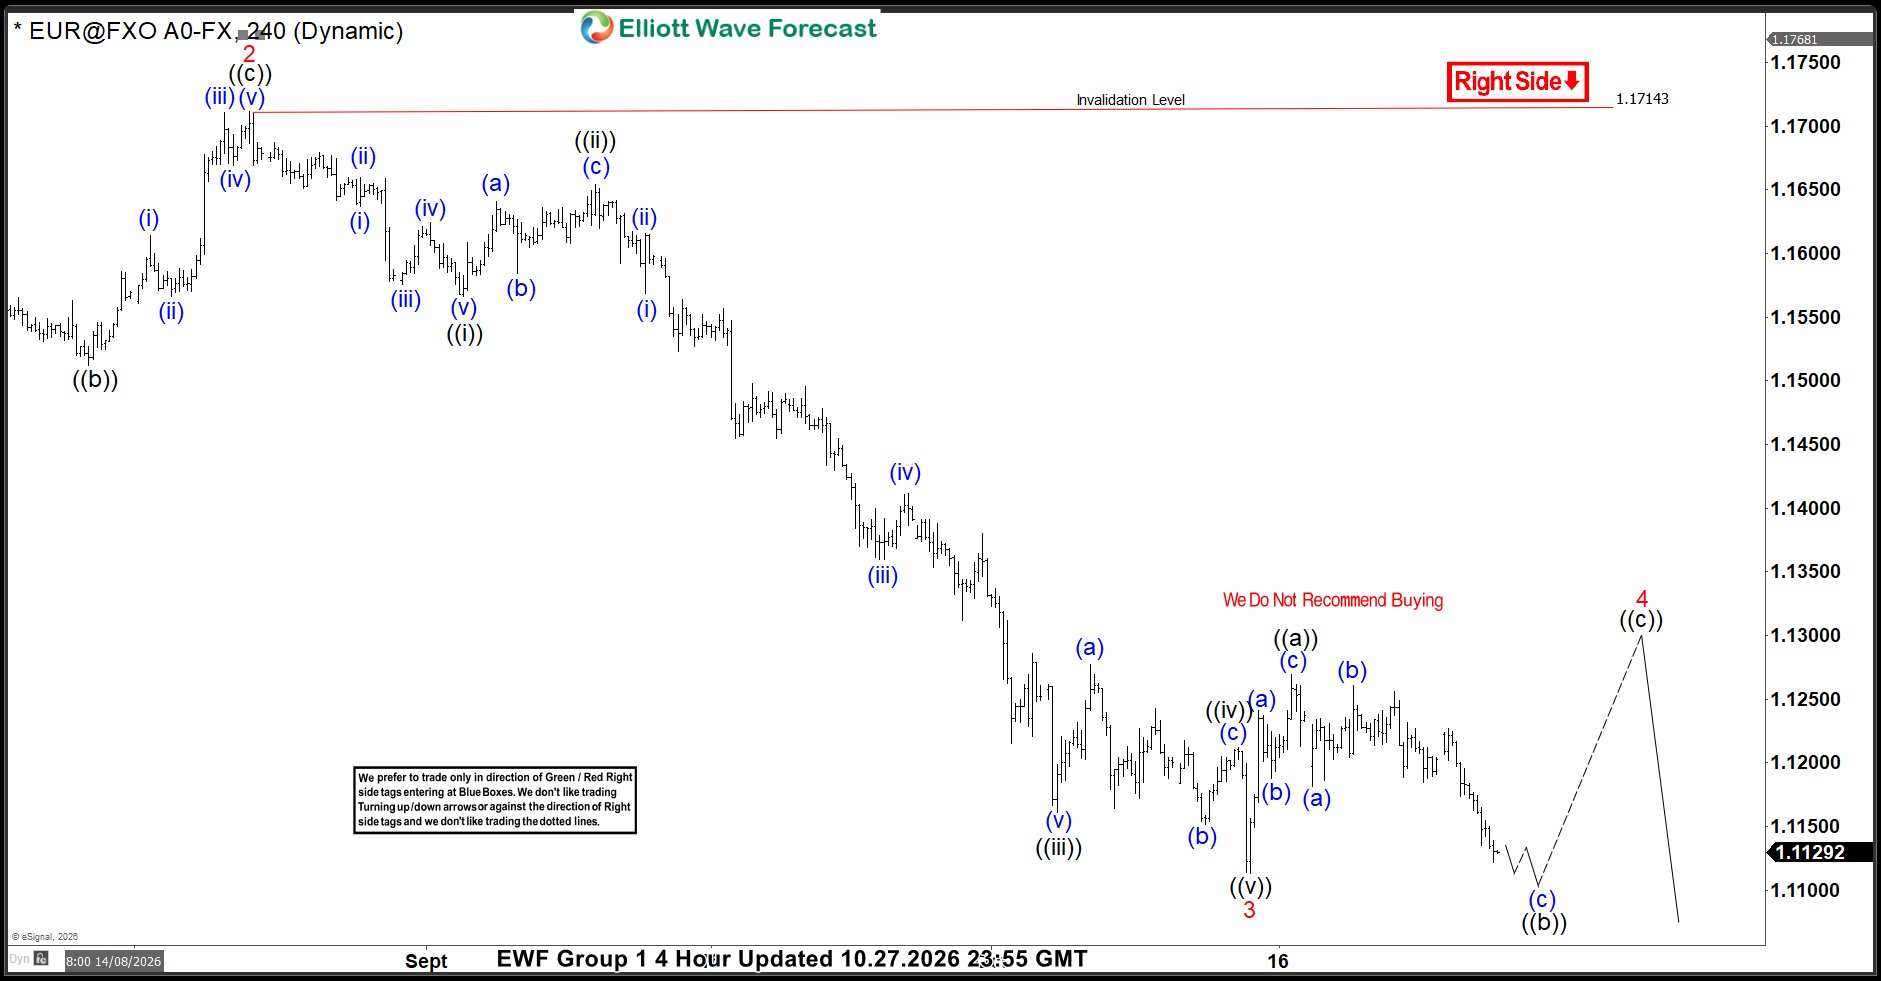
EURUSD before: October 27, 2026 four-hour update. The chart mapped a further dip followed by a corrective rebound.
By the November 4 update, the dip and rebound had unfolded in that order. Price had tested the 1.12649 equal-leg area and was near 1.12307 on the chart.
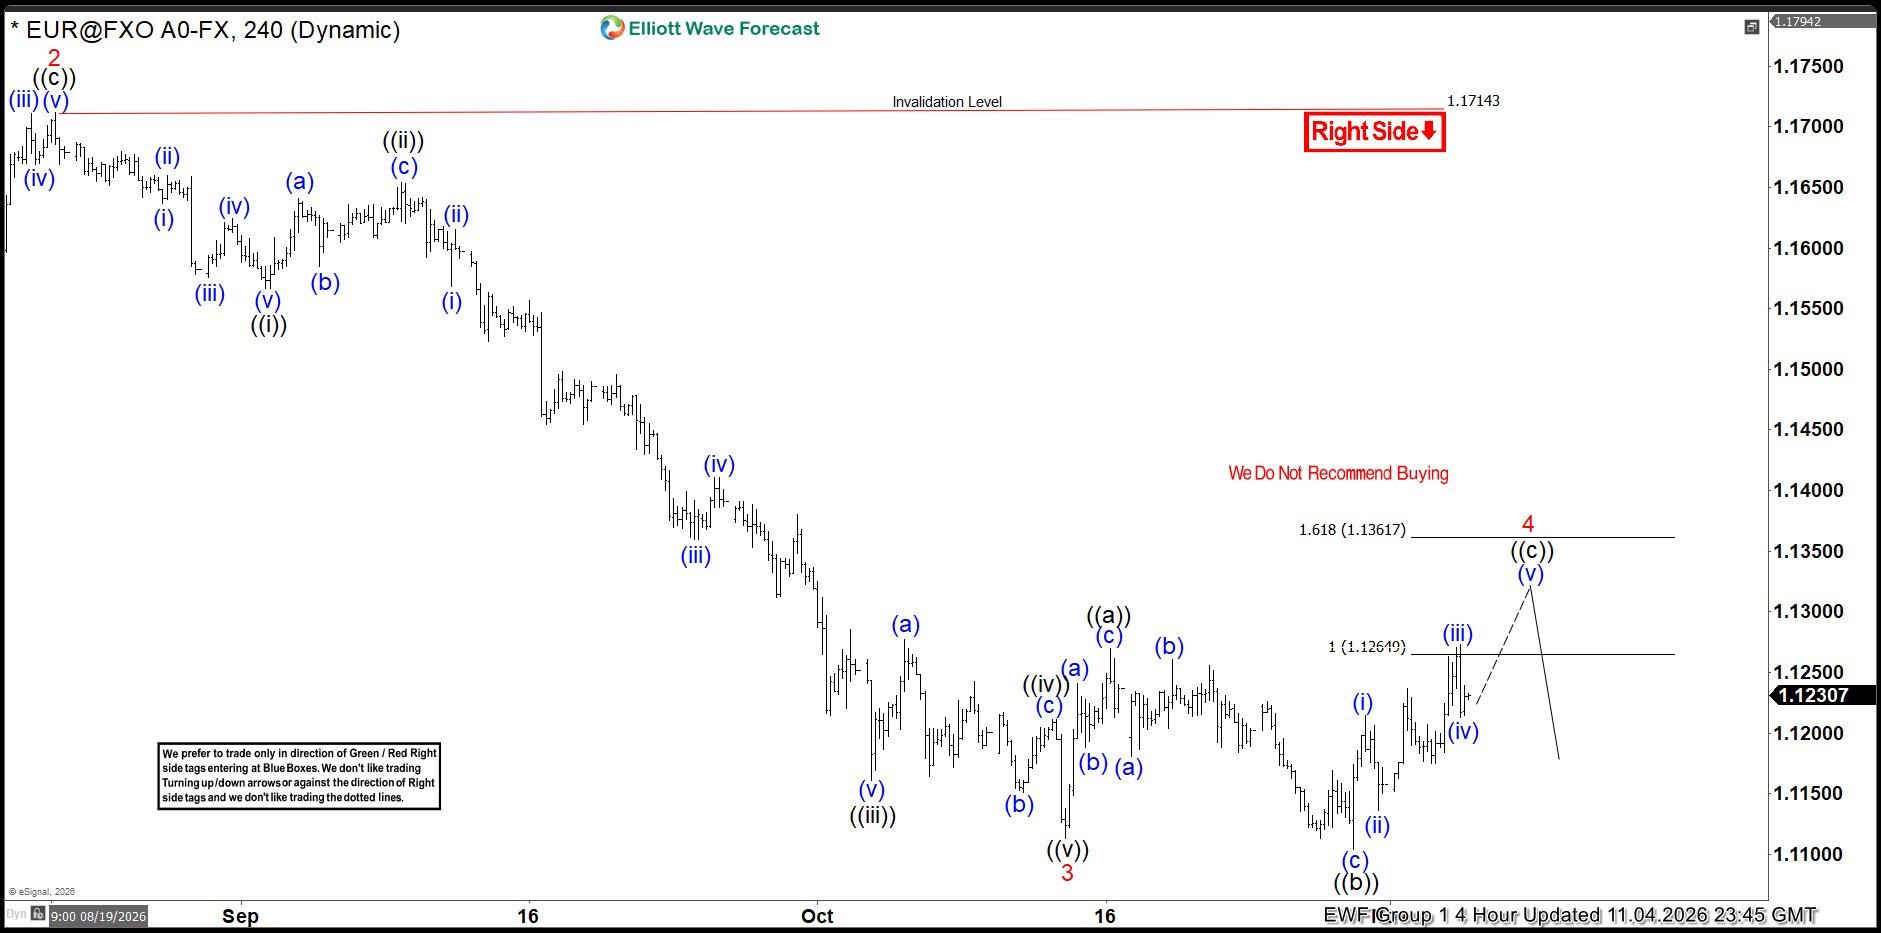
EURUSD after: November 4, 2026 four-hour update. Price rebounded into the equal-leg area.
The chart also marked 1.13617 as a 161.8% extension. Completion of the larger correction and a subsequent decline remained projections on that update, not confirmed outcomes.
The November 4 chart is therefore a useful checkpoint rather than a completed story: it shows the expected rebound developing, while the final wave 4 high and the next decline were still ahead in the analyst’s preferred scenario.
Dow Futures: A Deeper Pullback, Then a Reversal
Our October 29 Dow futures (YM) chart mapped a pullback, a corrective rally toward 54,000 and a reversal. The proposed rally was the final leg of the correction shown on that chart.
The distinction was important: the expected advance was framed as a corrective move within the larger structure. A strong rally on its own would not necessarily have meant the broader decline was finished.
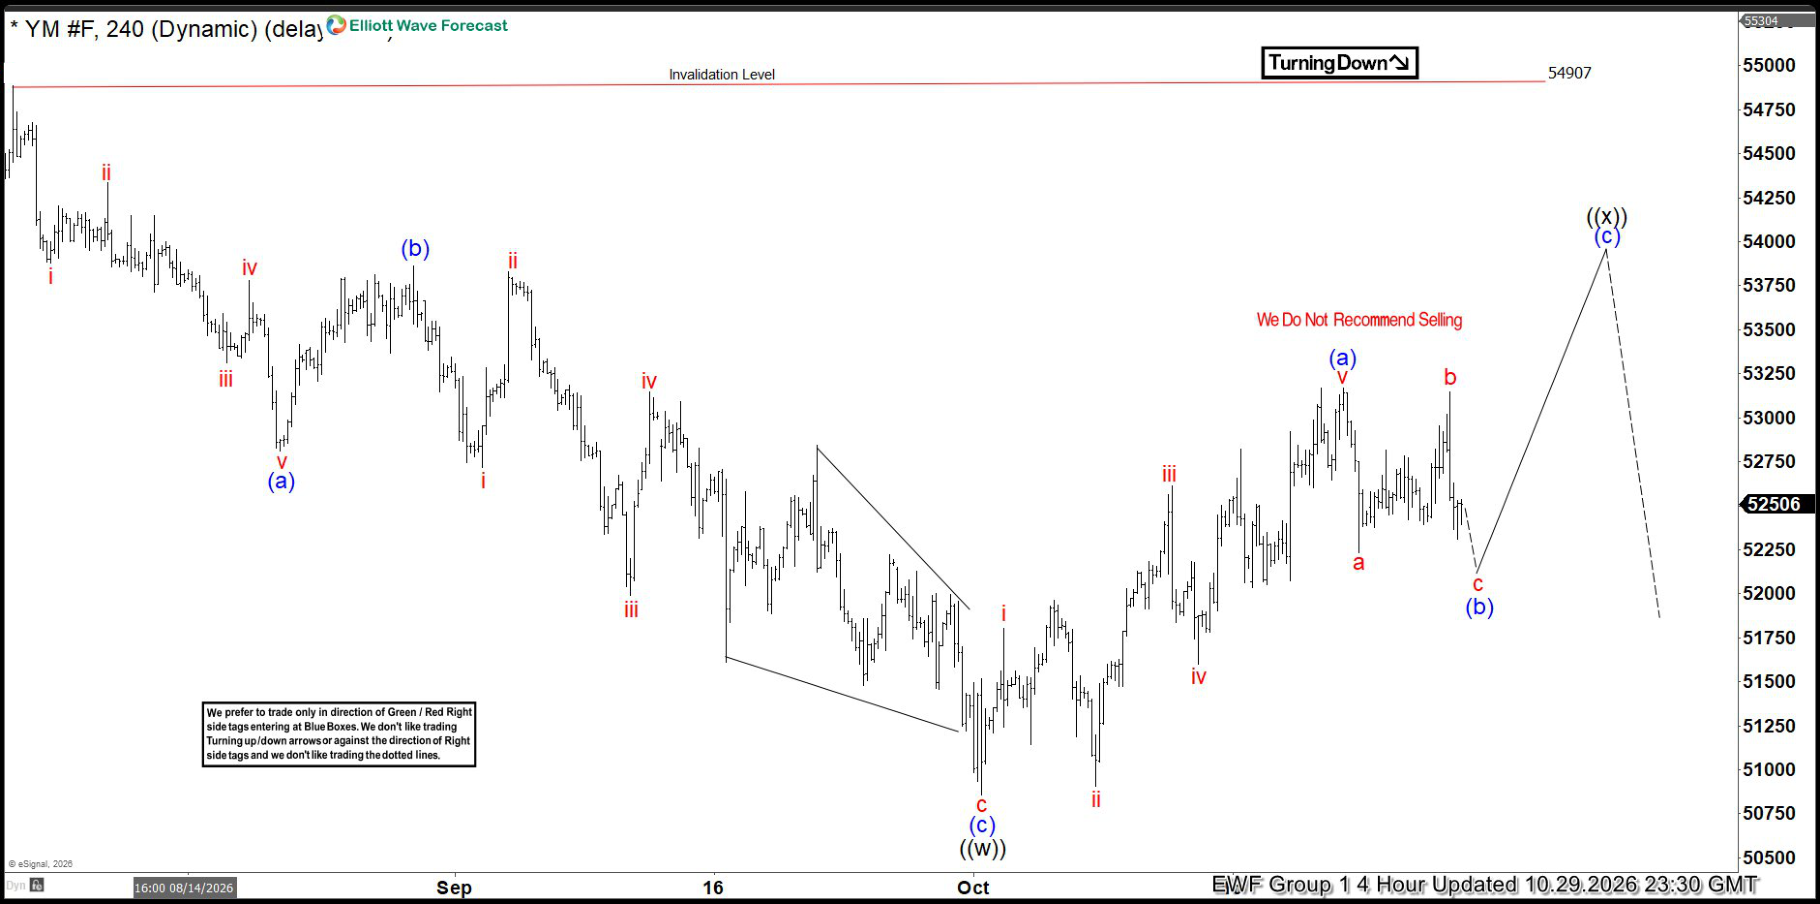
Dow futures before: October 29, 2026 four-hour update.
The initial pullback went deeper than the sketch, reaching roughly 51,400. YM then rallied through 53,735, the equal-leg level shown on the follow-up, peaked just below 54,000 and reversed toward 50,900.
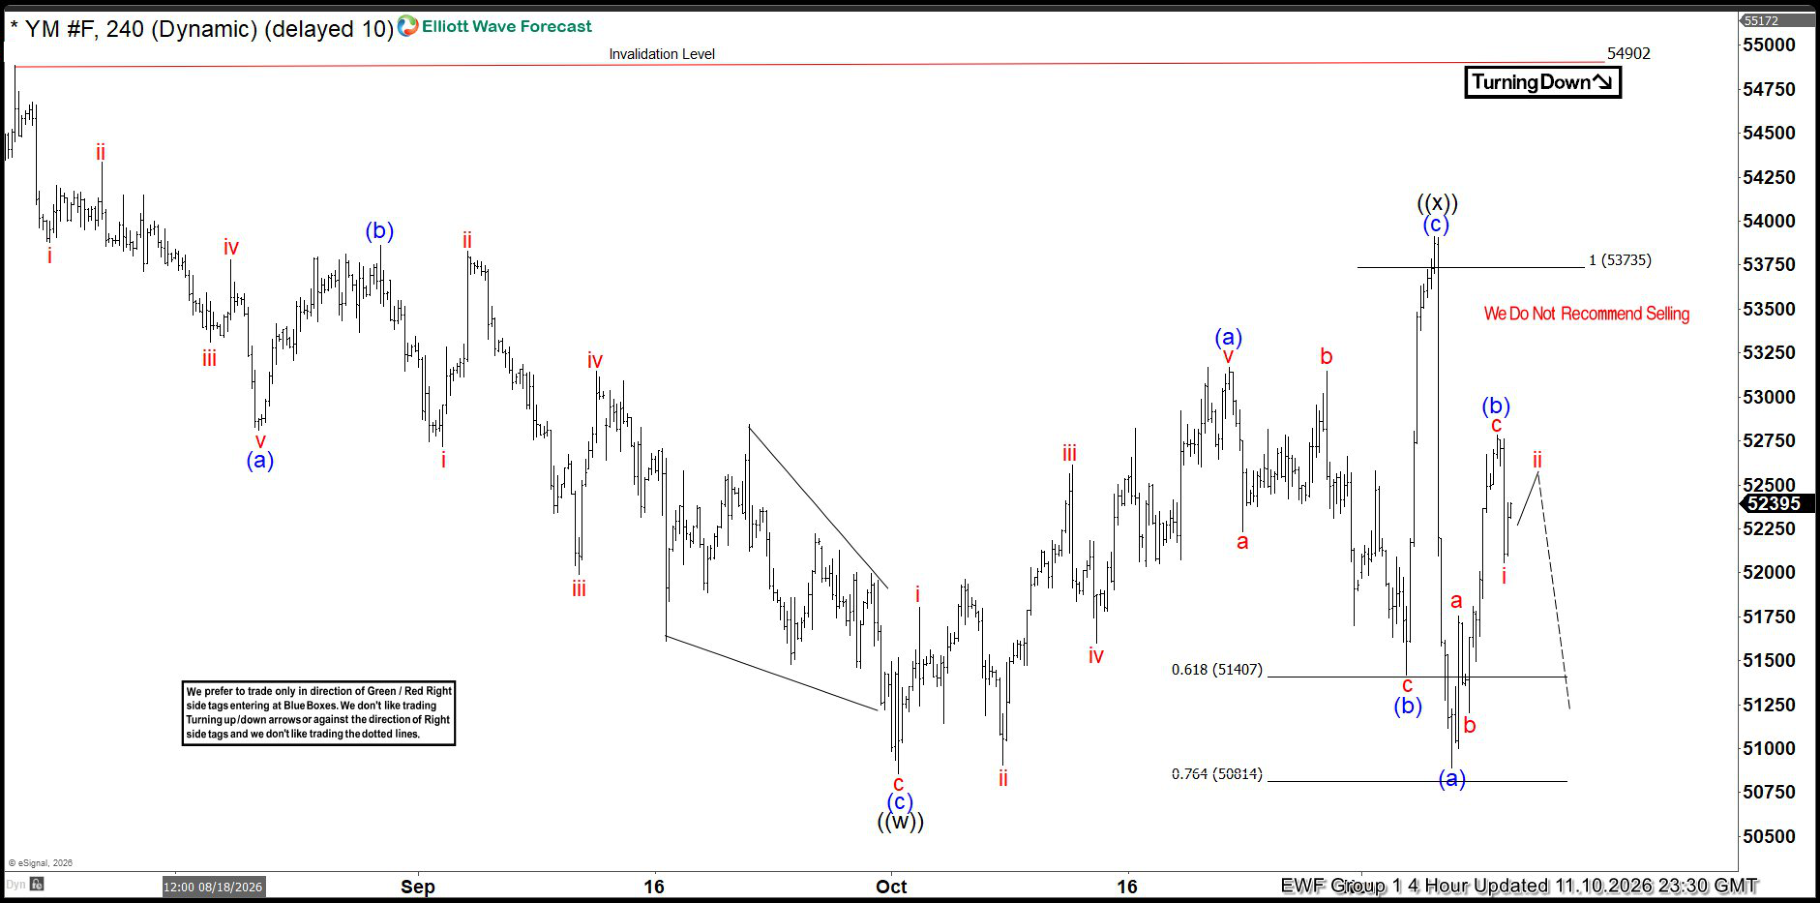
Dow futures after: November 10, 2026 four-hour update. The rally exceeded the equal-leg level before reversing.
The direction and order were broadly consistent with the roadmap; the deeper first pullback is an important difference. A path sketched on a chart is a scenario, not a promise that every swing will match it.
The November 10 update shows both sides of the comparison: the rally carried into the expected area, but the route there was more volatile than the earlier drawing. The later rebound on that chart was still developing, so its projected next move was not yet established.
Russell 2000 Futures: The Reversal Came Early
The November 3 Russell 2000 futures (RTY) chart showed price near 2,822 and sketched a corrective rally toward roughly 2,940, followed by a decline.
That roadmap allowed for several swings within the recovery before the larger correction turned down. It gave members a way to follow the developing rally without assuming that the first move higher ended the broader decline.
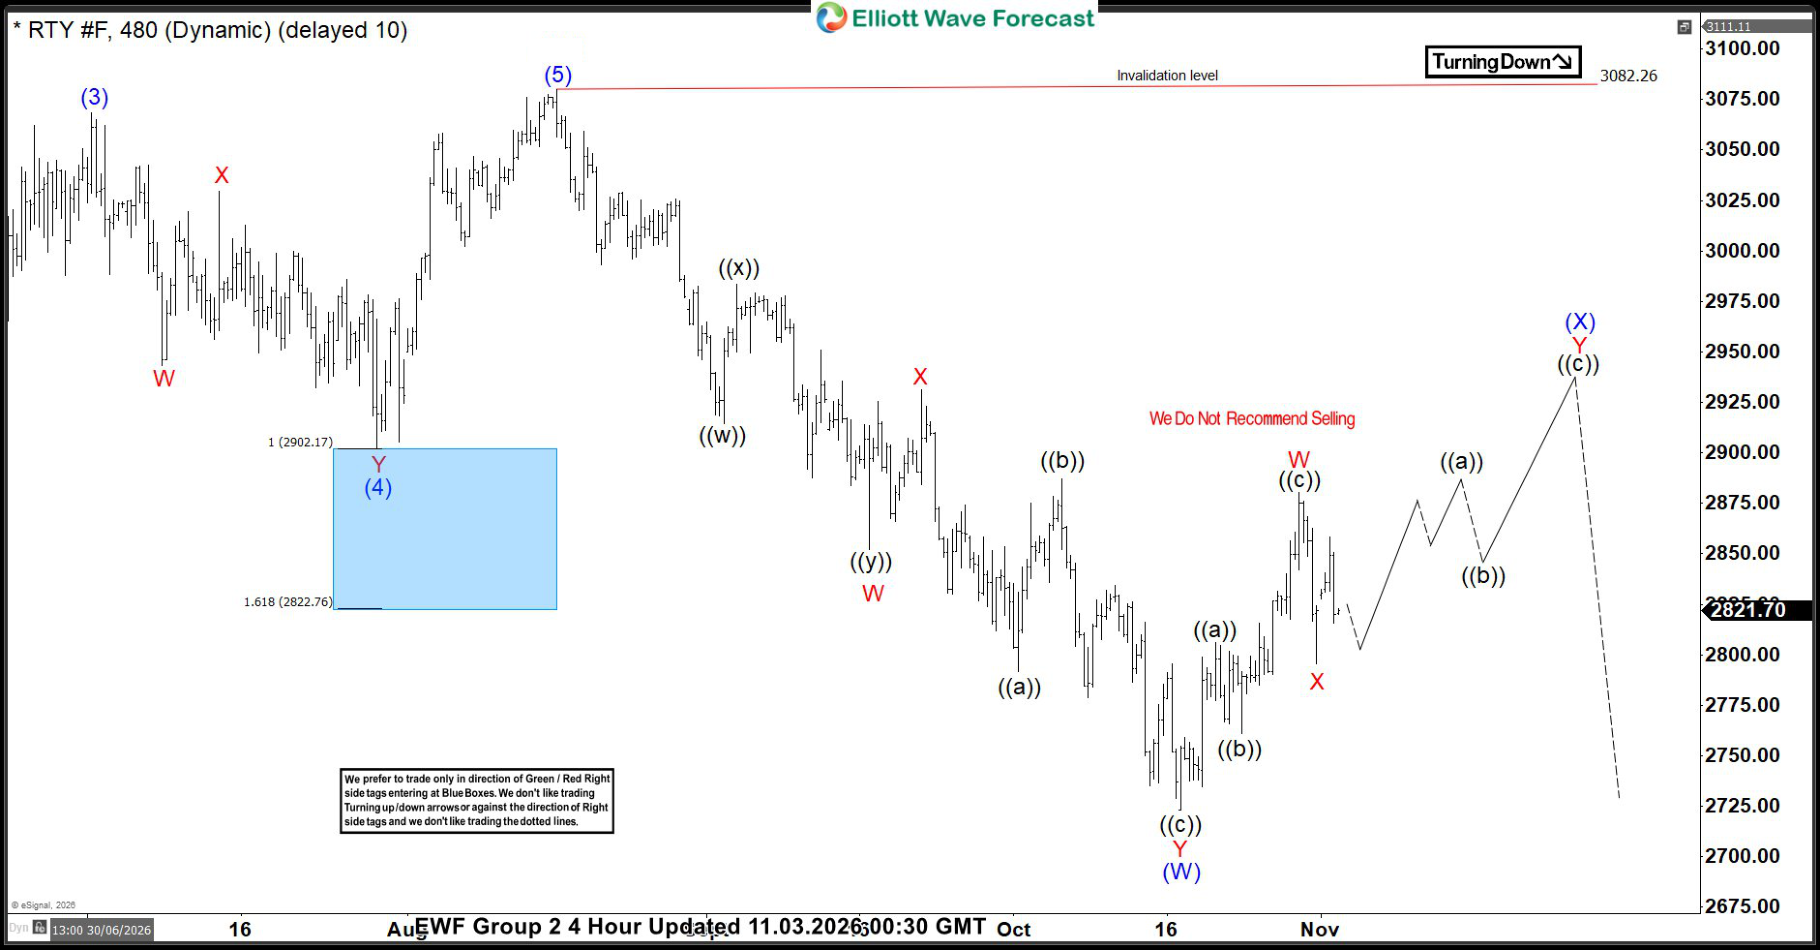
Russell futures before: November 3, 2026 update, timestamped 00:30 GMT.
On the November 11 follow-up, the high was labeled near 2,890. RTY then fell toward 2,715 before rebounding. The rally and reversal appeared in the projected order, but the turn came approximately 50 points before the sketched 2,940 area.
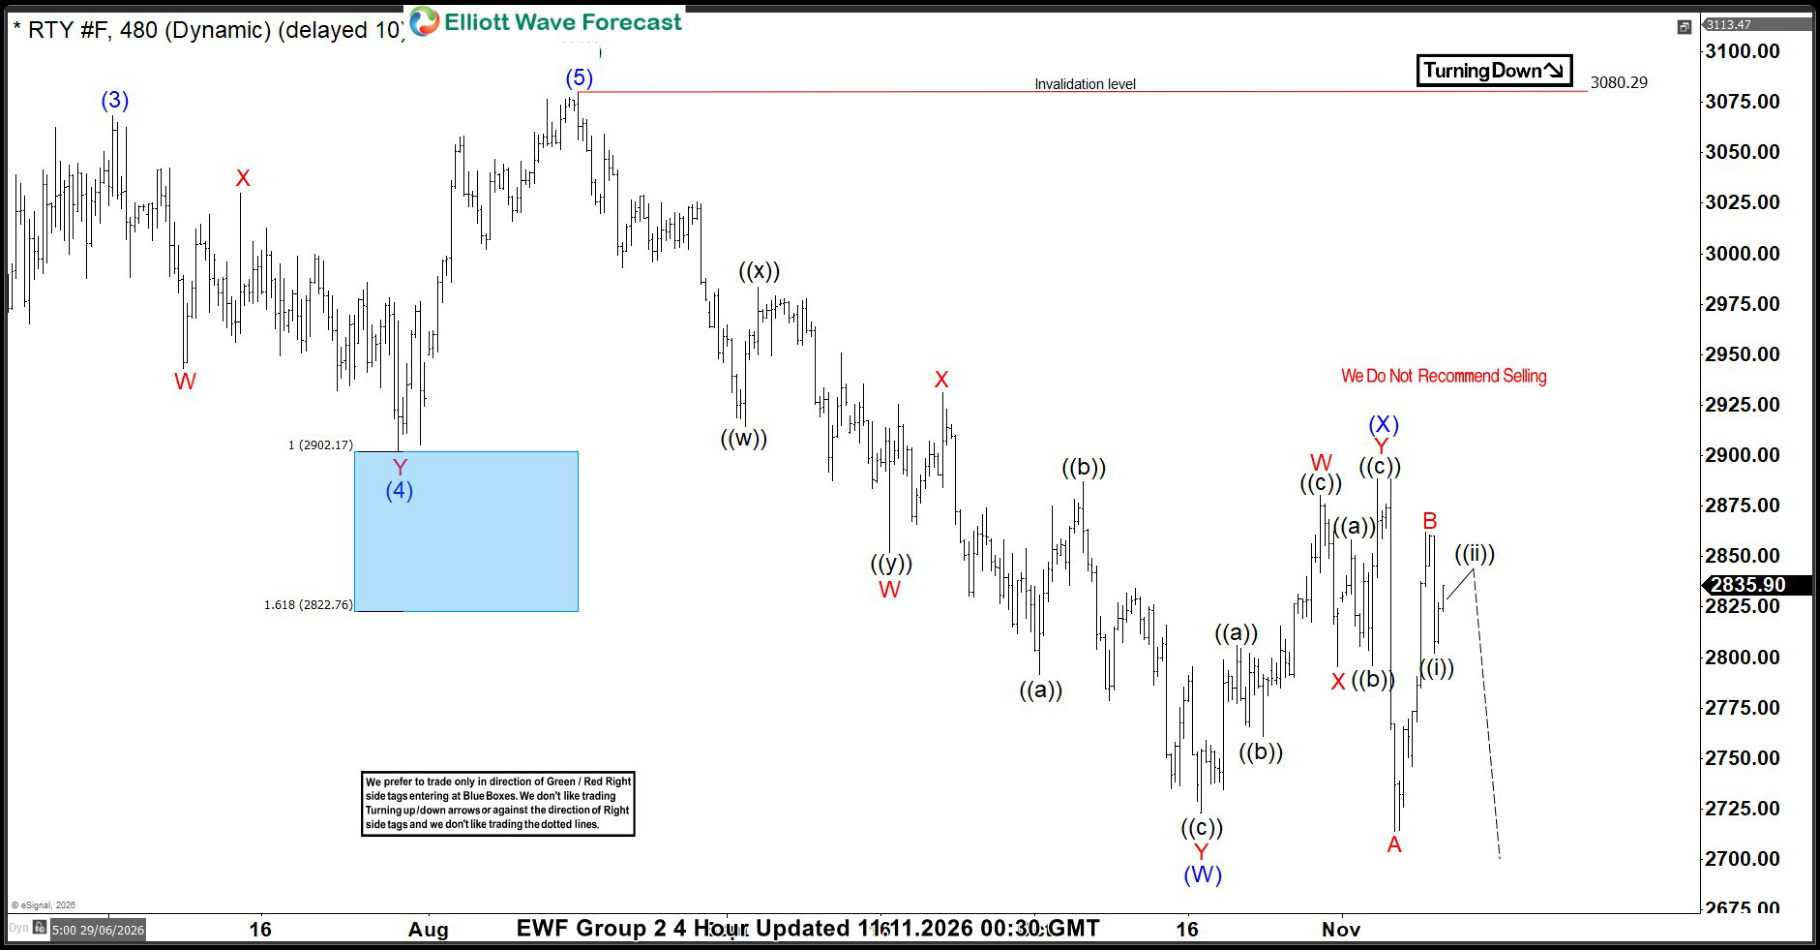
Russell futures after: November 11, 2026 update. The high developed below the original sketch.
For a trader waiting for the exact 2,940 level, that difference mattered. A forecast area is a reference for evaluating the developing structure, and the market may turn before it gets there.
The follow-up labeled the corrective high and showed the sharp drop that followed, as well as a rebound. That later bounce and the dashed path on the updated chart remained a developing scenario, not a confirmed subsequent decline.
AMD: The Rebound Gave Way to Another Decline
On November 2, AMD was near $470.50. The four-hour chart sketched a final dip toward $460, a corrective rebound toward $510, then renewed weakness. It marked $659.22 as the broader invalidation level.
The proposed rebound was presented as a correction against the decline from the October high. The chart framed a possible sequence for the next several swings, while the exact height of the rebound remained uncertain.
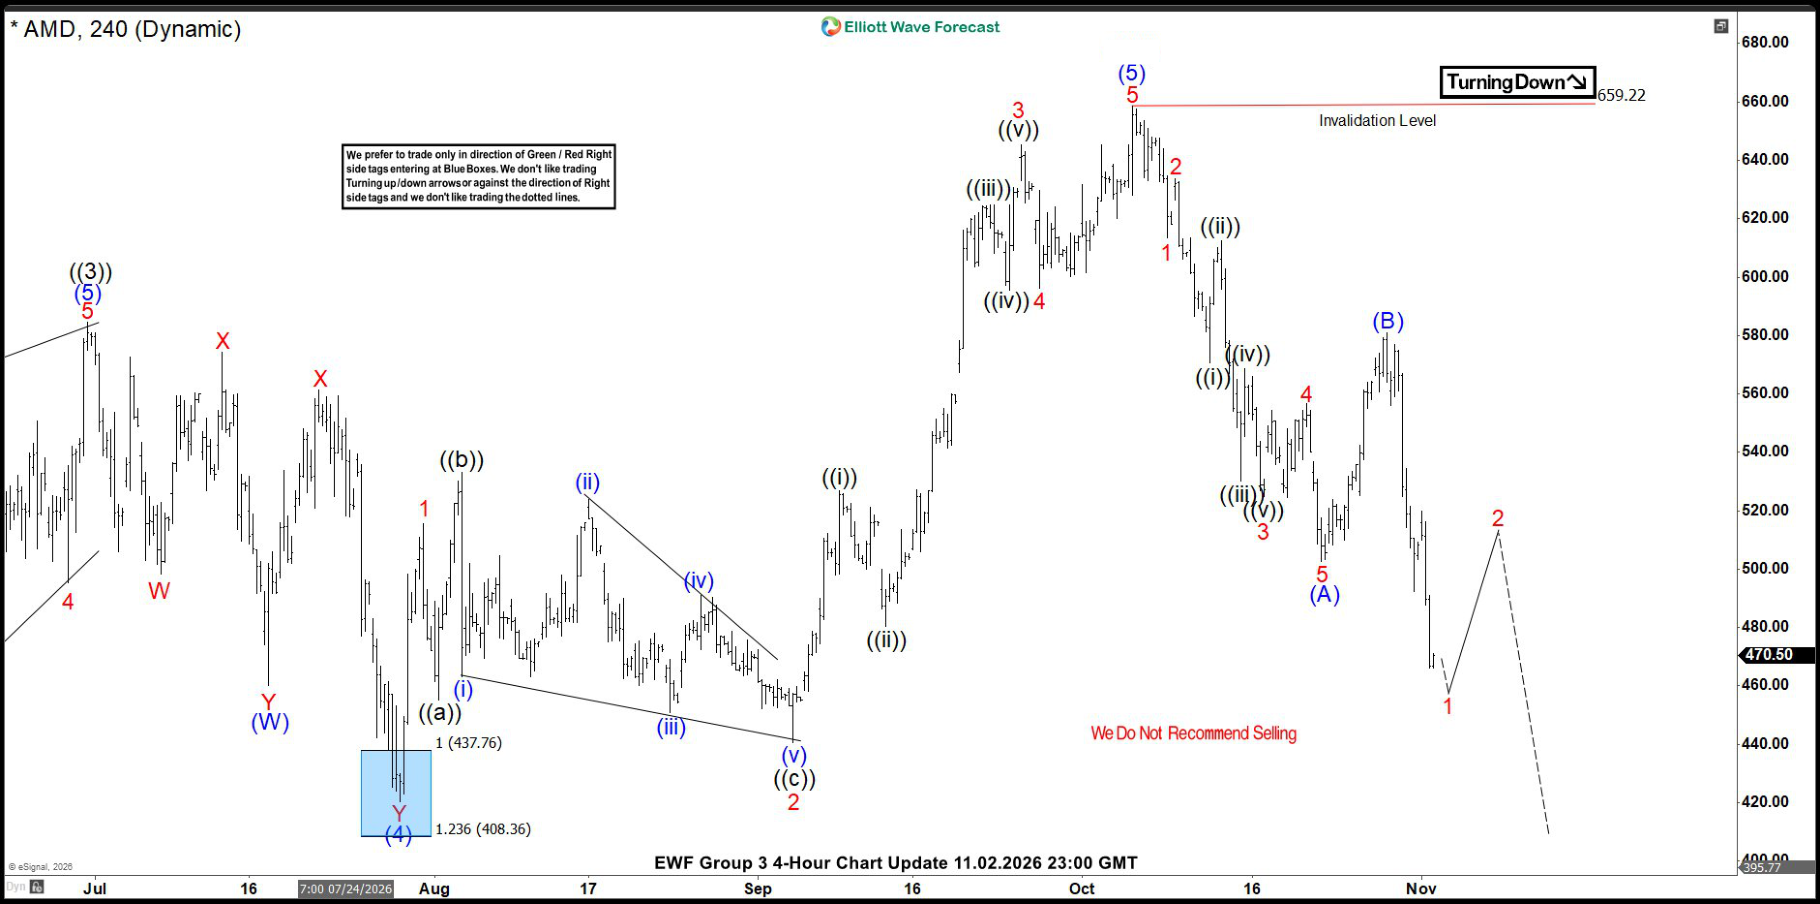
AMD before: November 2, 2026 four-hour update.
The rebound moved above $520, overshooting the original sketch, before AMD extended lower. On the November 5 update, price was near $403.06 and the decline was labeled as wave 3.
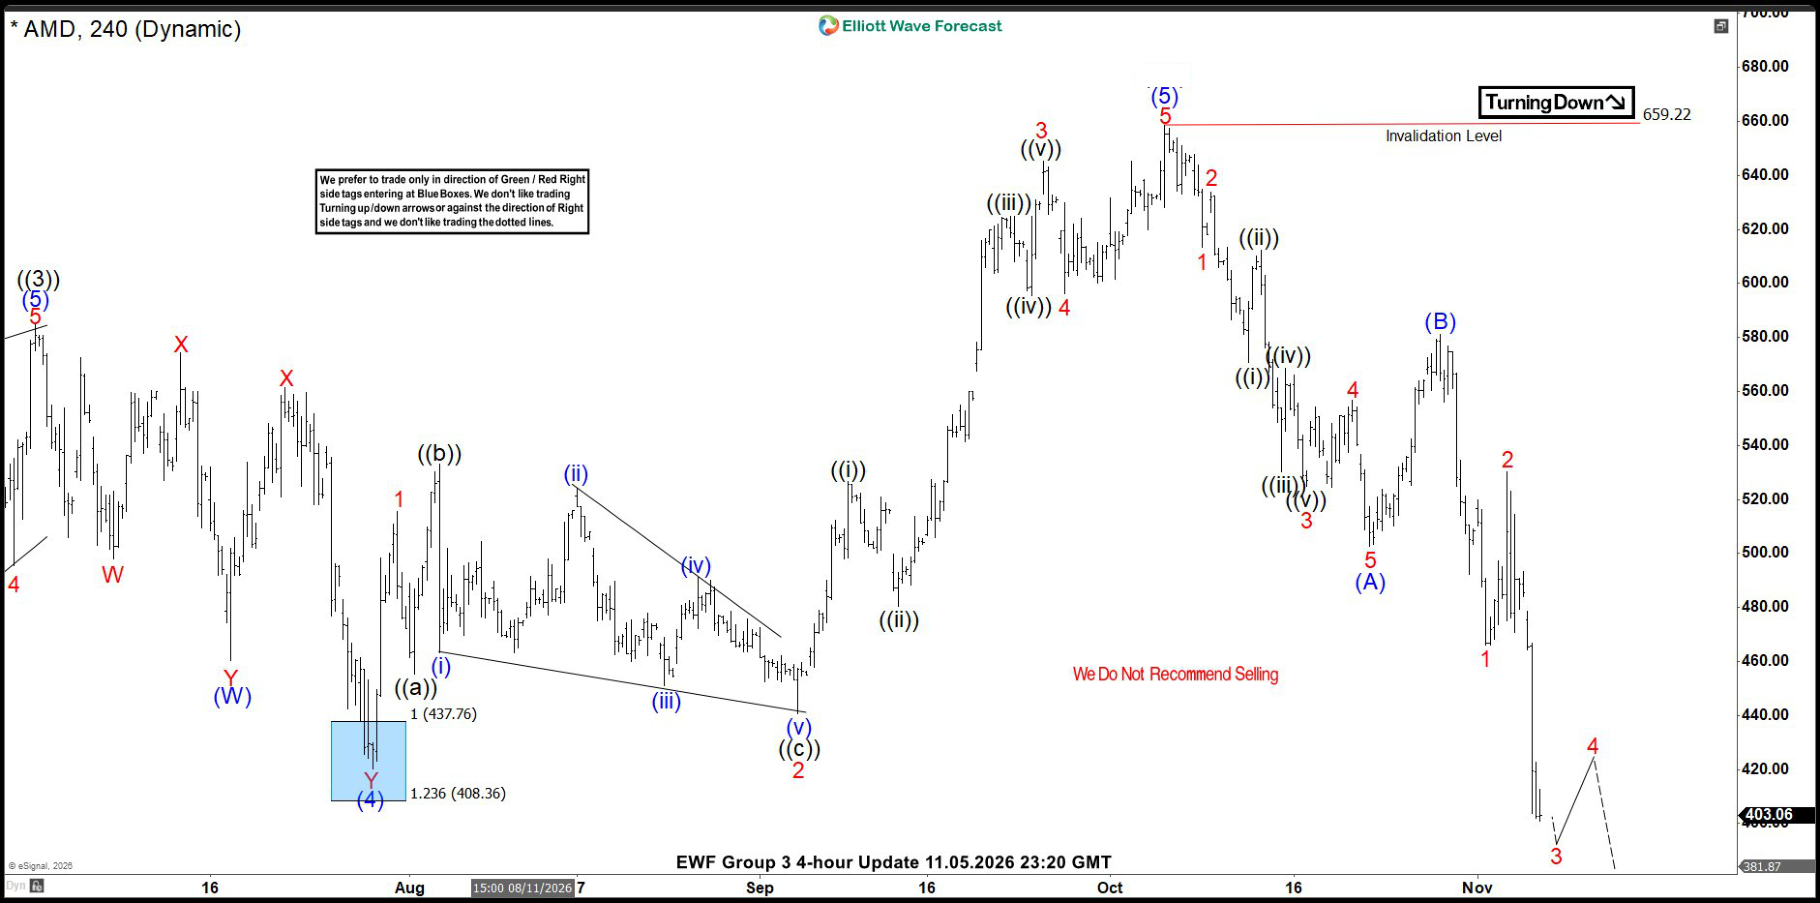
AMD after: November 5, 2026 four-hour update. The rebound exceeded the sketch before price fell.
The older Blue Box at $437.76–$408.36 on the left of the chart belongs to an earlier correction. It was not the projected reaction area for the November setup.
The later chart shows why sequence and precision should be judged separately: the dip, rebound and subsequent weakness appeared in the order sketched, but the rebound rose higher than the original illustration. The next bounce drawn on the November 5 chart remained a forecast.
Four Roadmaps Compared
Market | Original roadmap | What the follow-up showed |
|---|---|---|
EURUSD | Dip toward 1.1100, then rebound | Rebound reached the 1.12649 equal-leg area; the later path remained a projection. |
Dow futures (YM) | Pullback, rally toward 54,000, reversal | Deeper pullback, then rally just below 54,000 and reversal. |
Russell futures (RTY) | Rally toward 2,940, then decline | High near 2,890, then a fall toward 2,715. |
AMD | Dip, rebound toward $510, then decline | Rebound above $520, then decline to near $403.06. |
What Does a High-Frequency Area Tell Us?
At Elliott Wave Forecast, a High-Frequency Area, often shown as a Blue Box, is a price range where analysts watch for a reaction as a correction matures. One common approach measures the first leg of a correction, projects it from the intervening swing, and marks a range between the 100% and 161.8% Fibonacci extensions. The calculation depends on the structure being analyzed.
The wave count identifies the swings being measured. Fibonacci relationships help define an area to watch, while an invalidation level identifies where the preferred count needs to be reassessed. A Blue Box is not a guarantee of a turn.
Start with our Elliott Wave Theory guide, or compare WXY and ABC corrections. For a longer-term reaction-zone example, see the Gold Blue Box case study.
Fast markets also involve liquidity and execution risk. The Bank for International Settlements report on foreign-exchange execution algorithms discusses how automation affects execution and market functioning. These price charts alone cannot identify which participants or algorithms drove a particular move.
The Lesson: Use the Roadmap, Then Watch the Market
The four examples show why a pre-event plan can be useful even when the exact route changes. EURUSD followed the dip-and-rebound sequence. Dow futures pulled back more deeply than sketched. Russell futures reversed early, and AMD's rebound overshot its sketch before the decline.
Those differences are not minor details for someone making a trading decision. They affect whether a level is reached, whether a setup remains valid and how risk is managed. For an example of a path that failed and had to be revised, read Does Elliott Wave Actually Work?
Before the next major announcement, which levels and invalidations will you be watching?
What Would You Have Done With These Charts?
Put yourself back before the election results. Headlines were about to arrive, but each chart already set out a possible sequence. How would you have prepared?
EURUSD: Would you have been ready for a rebound after another push toward 1.1100?
Dow futures: How would you have assessed a strong rally if the chart framed it as the final leg of a correction?
Russell futures: Would you have considered the possibility of a reversal before the sketched 2,940 level was reached?
AMD: How would you have evaluated a rebound that exceeded the sketch before the decline resumed?
These questions are a way to review the charts, not recommendations to trade. A useful plan also accounts for the possibility that the preferred path fails.
Where Do These Markets Go Next?
The charts in this article are dated snapshots. Members received the original roadmaps before the later updates shown here, and the desk continues to update its views as price develops. A forecast can change when the structure or its invalidation changes.
A free chart provides one snapshot. The 14-day trial covers a selected group of 26 markets, while Diamond covers 78. EURUSD and Dow futures appear in Group 1, Russell futures in Group 2, and AMD in Group 3, so choose the group that matches the markets you follow.
MEMBER MARKET UPDATES
Follow the next market roadmap
See updated wave counts, potential reaction areas and invalidation levels for your selected markets. These public charts are snapshots; members can follow the desk as its views develop.
14-Day Trial $0.99
26 markets · Cancel Anytime · 24-hour notice required
Start My $0.99 Trial →
After 14 days, $199.99/month unless cancelled. Cancel at least 24 hours before renewal. Explore the free Elliott Wave Trading Mastery Bundle below this article.
Frequently Asked Questions
How did markets move around the 2026 midterm elections?
In the chart examples shown here, EURUSD dipped and rebounded, Dow and Russell 2000 futures rallied and reversed, and AMD rebounded before falling. These moves unfolded over several sessions and cannot be attributed to the election alone.
Can Elliott Wave predict election results or market reactions?
No. Elliott Wave analysis maps potential price structures and levels, not election outcomes. Forecasts can fail, turning points can differ from projections, and counts may need to be revised.
What is an Elliott Wave Forecast Blue Box?
A Blue Box is a price area where Elliott Wave Forecast watches for a possible reaction as a correction matures. Fibonacci extensions can help define the area, but a reaction is not guaranteed.
Why did Russell futures reverse before reaching the projected level?
The November 3 chart sketched a rally toward roughly 2,940, while the November 11 chart labeled the high near 2,890. A projected path is an estimate, and the actual turning point can come earlier or later.
Where can I follow updated Elliott Wave analysis?
Elliott Wave Forecast members can follow updated analysis for their selected markets. The 14-day trial is $0.99 for one group of 26 instruments; the groups cover different markets.
Risk disclosure: Stocks, futures and foreign exchange products involve substantial risk and may not be suitable for every investor. Futures and leveraged trading can result in losses greater than the initial deposit. This article is educational and is not investment advice. Historical examples are selected illustrations, not a complete track record. Past performance does not guarantee future results.
Source: https://elliottwave-forecast.com/stock-market/2026-midterm-election-market-elliott-wave-charts/



Comments
Log in or sign up to join the conversation.