

Tesla (TSLA) continues its recovery from some steep falls last week as the broader equity picture remains supportive. Friday's much anticipated Jackson Hole symposium went off without a hitch as Fed Chairman Powell delivered the perfect speech, carefully treading a path between not surprising markets too much but managing to mention the taper. The result was another move up in the S&P, Dow, and Nasdaq and more records in this, the year of the record.

Image Source: Pexels
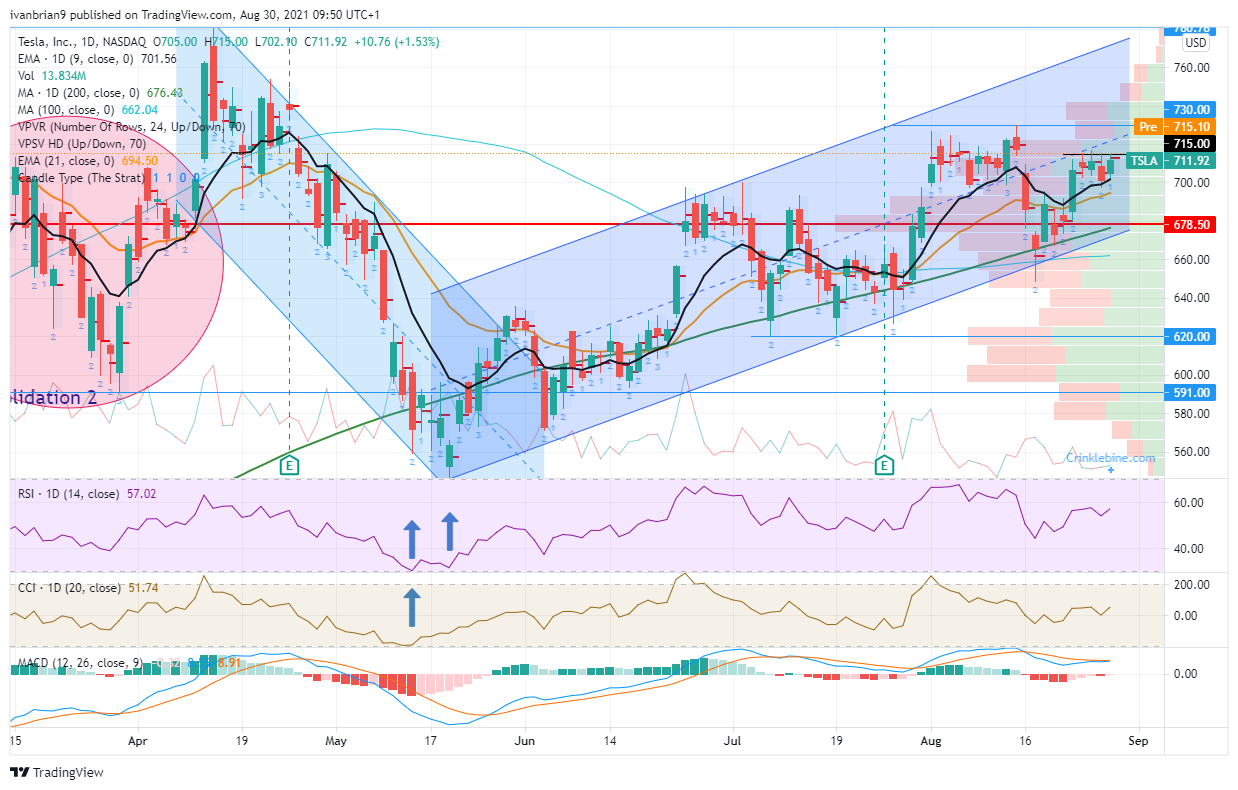
Tesla then followed suit as the stock continues its recovery from a few headwinds that saw the stock fall sharply last week. Tesla bottomed out at $648 and has been rising steadily ever since. Once again the stock retreated and recharged at its 200-day Simple Moving Average (SMA), a feat Tesla has done many times in 2021. Now with the move on Friday, Tesla stock has recaptured the 9 and 21-day SMAs and put itself back on track for a test of $730.
(Click on image to enlarge)
-637659098002246195.png)
Tesla key statistics
| Market Cap | $704 billion |
| Price/Earnings | 354 |
| Price/Sales | 23 |
| Price/Book | 29 |
| Enterprise Value | $756 billion |
| Gross Margin | 22% |
| Net Margin |
6% |
| 52-week high | $900.40 |
| 52-week low | $329.88 |
| Average Wall Street Rating and Price Target | Hold, $711 |
Tesla stock forecast
The move on Friday was steady with a strong early start to the session consolidating as the day wore on. This move has taken Tesla back above a $700 billion market cap, but most importantly as mentioned from a technical perspective, back above the two main short-term SMAs, the 9 and 21-day. We can see from the chart below the first resistance is a small one at $715.
Tesla stock has been testing to get through here a few times last week but failed each time, so we need to break this hurdle today. Once through there it is onward and upwards to test the $730 resistance. That is the real level the bulls want to take out as we can see the volume profile bars on the right of the chart clearly showing how light volume gets above $730, which makes it easier for bulls to push the stock higher. $780 is the resistance above, a level not seen since April.
To try and get some momentum going and ensure no return to the choppy trading we have suffered through lately, we would not like to see Tesla breaking the 9-day SMA at $665. From a longer-term perspective, the key support is at $649. This is the low from August 17, and breaking it would mean a lower low and end the uptrend.
A break of $715 and $730 should be confirmed by the Moving Average Convergence Divergence (MACD) crossing over.
(Click on image to enlarge)

Comments
Log in or sign up to join the conversation.