

Tesla Motors, Inc. (TSLA) designs, manufactures, and sells electric vehicles and electric vehicle powertrain components. The Company is headquartered in Palo Alto, California.
Our models have been down on Tesla for a while now. We put a sell on the stock back in early September. Prior to that the firm had a brief spell as a HOLD from July 6th to September, but it spent the rest of 2015 as a STRONG SELL or SELL.
Today, investors also realized that all was not well at the alternative vehicle manufacturer. Shares took a dive on news that Consumer Reports, the "bible" of car reliability ratings, had found the car to possess worse-than-average predicted reliability. While drivers reported some typical issues for newer vehicles--such as sun roof leaks,squeaks, and body rattles, more significant were issues relating to the car's transmission and battery charging systems.
One wonders how this will effect sales given the fact that up until now the company had such strong demand it could not fill all orders in a timely fashion. Teslas are NOT cheap, and people ready to pay a premium for a vehicle that requires special charging equipment may not be quite so sanguine about laying out that extra money if the vehicle is not as plush or refined as others in its price range.
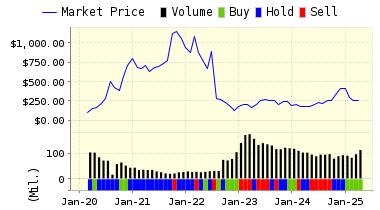
Below is today's data on TSLA:
Recommendation: We continues with SELL recommendation on Tesla Motors, Inc. for 2015-10-19. Based on the information we have gathered and our resulting research, we feel that Tesla Motors, Inc. has the probability to UNDERPERFORM average market performance for the next year. The company exhibits UNATTRACTIVE Book Market Ratio and Price Sales Ratio.
|
ValuEngine Forecast |
||
|
Target |
Expected |
|
|---|---|---|
|
1-Month |
226.17 | -0.85% |
|
3-Month |
227.99 | -0.05% |
|
6-Month |
233.48 | 2.36% |
|
1-Year |
204.92 | -10.16% |
|
2-Year |
277.71 | 21.75% |
|
3-Year |
282.05 | 23.65% |
|
Valuation & Rankings |
|||
|
Valuation |
35.03% overvalued |
Valuation Rank |
 7 7 |
|
1-M Forecast Return |
-0.85% |
1-M Forecast Return Rank |
8 |
|
12-M Return |
-1.03% |
Momentum Rank |
54 |
|
Sharpe Ratio |
0.91 |
Sharpe Ratio Rank |
95 |
|
5-Y Avg Annual Return |
49.99% |
5-Y Avg Annual Rtn Rank |
99 |
|
Volatility |
55.21% |
Volatility Rank |
32 |
|
Expected EPS Growth |
188.93% |
EPS Growth Rank |
93 |
|
Market Cap (billions) |
28.60 |
Size Rank |
96 |
|
Trailing P/E Ratio |
n/a |
Trailing P/E Rank |
27 |
|
Forward P/E Ratio |
94.65 |
Forward P/E Ratio Rank |
4 |
|
PEG Ratio |
0.45 |
PEG Ratio Rank |
63 |
|
Price/Sales |
7.72 |
Price/Sales Rank |
12 |
|
Market/Book |
39.95 |
Market/Book Rank |
3 |
|
Beta |
0.85 |
Beta Rank |
53 |
|
Alpha |
0.05 |
Alpha Rank |
69 |
Market Overview
|
Summary of VE Stock Universe |
|
|
Stocks Undervalued |
57.62% |
|
Stocks Overvalued |
42.38% |
|
Stocks Undervalued by 20% |
24.03% |
|
Stocks Overvalued by 20% |
13.78% |
Sector Overview
|
Sector |
Change |
MTD |
YTD |
Valuation |
Last 12-MReturn |
P/E Ratio |
|
0.55% |
5.00% |
0.46% |
5.91% overvalued |
3.61% |
23.37 |
|
|
0.64% |
4.96% |
-1.18% |
3.64% overvalued |
4.39% |
24.02 |
|
|
1.16% |
5.53% |
-9.46% |
1.17% overvalued |
-5.76% |
20.29 |
|
|
0.31% |
2.99% |
0.02% |
0.27% overvalued |
1.10% |
16.67 |
|
|
-0.40% |
5.13% |
-5.69% |
0.60% undervalued |
-3.34% |
22.32 |
|
|
0.17% |
5.00% |
2.96% |
1.82% undervalued |
4.03% |
26.32 |
|
|
0.34% |
4.22% |
-2.69% |
2.30% undervalued |
3.88% |
28.77 |
|
|
-0.13% |
4.23% |
-1.49% |
3.75% undervalued |
-3.89% |
17.64 |
|
|
0.83% |
3.17% |
-6.81% |
3.75% undervalued |
4.50% |
22.49 |
|
|
-0.77% |
1.61% |
2.51% |
3.88% undervalued |
6.78% |
29.43 |
|
|
0.98% |
6.95% |
-7.69% |
4.17% undervalued |
-8.14% |
18.10 |
|
|
1.04% |
4.83% |
-0.79% |
5.00% undervalued |
7.95% |
20.82 |
|
|
-0.13% |
13.79% |
-17.32% |
8.34% undervalued |
-37.50% |
26.09 |
|
|
-0.86% |
5.41% |
-12.29% |
8.60% undervalued |
-3.32% |
15.64 |
|
|
-0.58% |
8.47% |
-3.50% |
9.54% undervalued |
4.14% |
15.29 |
|
|
2.67% |
10.78% |
-14.02% |
12.01% undervalued |
-17.51% |
24.20 |
Valuation Watch: Overvalued stocks now make up 42.38% of our stocks assigned a valuation and 13.78% of those equities are calculated to be overvalued by 20% or more. Four sectors are calculated to be overvalued.
Comments
Log in or sign up to join the conversation.