

During yesterday's session, the U.S. Nasdaq marked new all-time highs supported mainly by the rises led by Tesla (TSLA) to score 5.27%. This came after the company, led by Elon Musk, announced the opening of a solar energy charging and storage station in the capital of the Autonomous Region of Tibet in China.
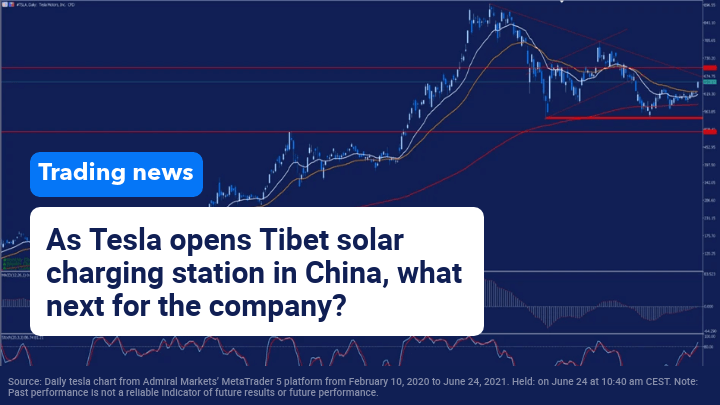
Despite the generally positive results presented last April, doubts arising from an increase in inflation in the United States and the crisis caused by the shortage of semiconductor chips caused Tesla to break down the upward channel that had been following since the beginning of last March, which led the price to make a double-bottom formation as we commented in our analysis last May.
This double-bottom is represented by the level of the red stripe, and after relying on its average of 200 sessions in the red, the price has begun a new upward movement that could confirm the change of trend if it is finally able to overcome upwards the medium-term downtrend line that began at the beginning of the year at its all-time highs around 900 dollars per share.
As long as the price is not able to overcome its downtrend line, sentiment will remain negative, although a possible breakout of this level could cause a strong upward movement.
Tesla and Elon Musk are without doubt one of the major players in the market, so every news update about them garners the attention of the markets. Recently, we learned that the famous investor Michael Burry has positioned himself short in this company, so it seems that the volatility in this stock will continue to be important.
(Click on image to enlarge)

Source: Daily tesla chart from Admiral Markets’ MetaTrader 5 platform from February 10, 2020 to June 24, 2021. Held: on June 24 at 10:40 am CEST. Note: Past performance is not a reliable indicator of future results or future performance.
Evolution of the last 5 years:
- 2020: 743.40%
- 2019: 25.71%
- 2018: 6.89%
- 2017: 45.69%
- 2016: -10.96%
Another of the great protagonists in the electric vehicle sector is undoubtedly NIO (NIO). If we look at the daily chart of this Chinese company listed in the United States, we can see how after marking historical highs at the beginning of this year around $66.90 per share, the price has followed a downward trend thus confirming the negative divergence that we could observe in its MACD indicator. This has led it to make a double-floor formation around $31 per share in the middle of last month.
Since that time, the price has experienced a strong upward trend that has led it to overcome several levels of resistance, causing an upward crossover of moving averages to reach again $48 per share.
Currently, the price is at the 23.6% Fibonacci retracement level of the latest uptick momentum in the vicinity of its 18-session moving average. These levels are currently its main support levels, so they could be an important support point for the future and in the face of new upward momentum. The loss of these levels would open the door to a retracement to the 38.2% Fibonacci level and if the price loses this level the current upward structure would be endangered.
(Click on image to enlarge)

Source: Daily NIO chart of Admiral Markets' MetaTrader 5 platform from February 10, 2020 to June 24, 2021. Held: on June 24 at 10:45 a.m. CEST. Note: Past performance is not a reliable indicator of future results or future performance.
Evolution of the last 3 years:
- 2020: 1112.24%
- 2019: -36.89%
- 2018: -8.74%



Comments
Log in or sign up to join the conversation.