President & Chief Market Strategist at IntheMoneyStocks•
Share:
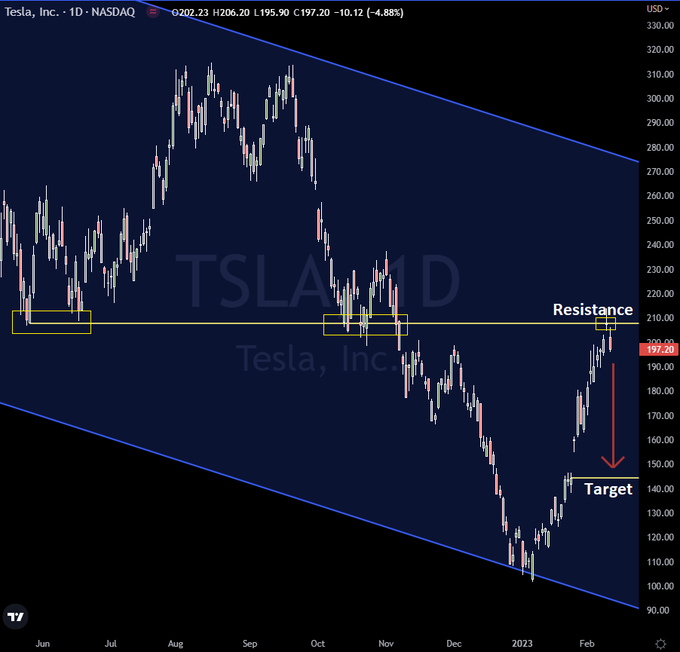
TSLA chart showcasing a classic reversal doji yesterday.
Tesla (TSLA) chart showcasing a classic reversal doji yesterday. The downside today begins after it slammed into major resistance (note the chart). Target is likely $145 (gap fill).
All comments made by InTheMoneyStocks, LLC and its subsidiaries, instructors, and representatives are for educational and informational purposes only and should not be construed as investment advice regarding the purchase or sale of securities, or any other financial instrument of any kind. Please consult with your financial adviser before making an investment decision regarding any securities mentioned herein. InTheMoneyStocks, LLC and its representatives assume no responsibility for your trading and investment results. All information on the website was obtained from sources believed to be reliable., but we do not warrant its completeness or accuracy, or warrant any results from the use of the information. InTheMoneyStocks, LLC, its employees, representatives and affiliated individuals may have a position or effect transactions in the securities herein and or otherwise employ trading strategies that may be consistent or inconsistent with the provided strategies. Trading of any type involves a very high degree of risk. Futures and Options trading are not suitable for all investors. Past results are not indicative of future results. InTheMoneyStocks, LLC, its subsidiaries and all affiliated individuals assume no responsibility for your trading and investment results.


Comments
Log in or sign up to join the conversation.