
Head and shoulders (knees and toes).

[Chart above by Dave Fry.]
That's the chart pattern that is now shaping up (if you are into such things) and, in fact, it will be marked by a small bouncy "rally" that ultimately fails before our strong bounce lines and ultimately cracks below the bottom of the old channel.
Like yesterday, in our Member Chat Room, I said I thought the best risk/reward play for AAPL was playing them for an earnings miss by picking up the next week $500 puts for $2, which could be $10 if AAPL disappoints. Well, disappoint they did and we'll see if we hit our 400% target gains on that one today.
Long-term, we're still long on AAPL and we will be pressing out long bets on this pullback (see my notes on AAPL earnings and trade ideas in this morning's Member Chat, below) but we're not in a hurry until we see the indices shape up:
AAPL still languishing around $505 but Futures bouncing back half a point, except the Nas, which is down about half a point. Don't be fooled by the Futures though, They are bouncing back to where they were at 1:30 pm and another failure there would not be good at all.
Amazingly, AAPL has pretty much announced they'll be moving into the mobile payment space with their 400M ITunes users (Visa has 50M users) and no one seems to be doing the math on that! Of course, it's hard to get traction when CNBC runs headlines like this:
This is how bad it could get for Apple stock
In the article, they are talking about a 40% drop ($350) due to these "horrific" earnings, especially guidance, where AAPL "only" forecasts $43Bn in sales with the usual 37% margins. This Q they made $13Bn per $550 share (now $505). At $505, that's about $14.50 per share or a current p/e of 8.7 (assuming 3 more "terrible" quarters like that one) NOT INCLUDING, of course, their $160Bn pile of cash which at $420Bn, is 40% of their market cap.
So AAPL $505 is RIDICULOUS. It's a BUYBUYBUY and, if they drop to $400, then it's a BUYBUYBUY. You will hear ever single moron who ever had an opinion lining up to dis AAPL today but keep in mind we EXPECTED this reaction – we took a very light bullish entry in our LTP, despite the fact that AAPL is my stock of the year because we were only worried it might go up and we'd miss our chance but mostly, we were waiting for this!
We'll have plenty of fun trade ideas in Member Chat and we'll be cashing in our AAPL puts, which should be up nicely and, of course, we have the Fed tomorrow – so a very exciting couple of days ahead of us.
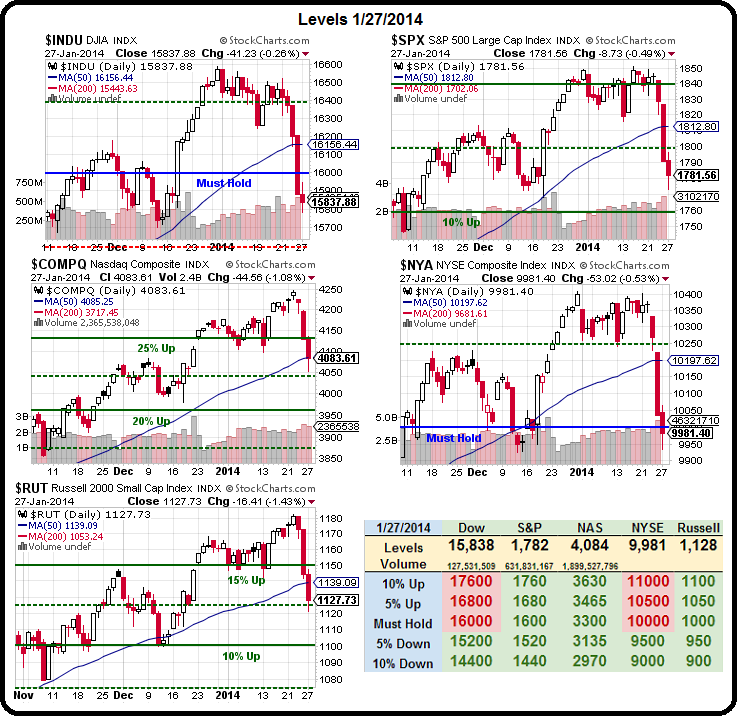
The Nasdaq was only saved by the 50 dma and will open today below it (4,085) while the the rest have plowed through theirs and may be on the way to visit the 200 dmas – 5% below this point and on the way to the 10% correction we expected.
We were not fooled into making any bullish bets yesterday (other than some fun Futures plays on the bounces) because our weak bounce lines were never crossed. Now, as the market gets weaker, we'll have to redraw our bounce lines to accommodate the wider range.

[Chart by David Fry]
This does not change our 5% Rule's™ ranges at all – these are just the very short-term moves we need to see in order to start pulling back our bearish bets (long in place) and begin to consider some bullish plays:
- Dow 15,940 (weak) and 16,080 (strong)
- S&P 1,794 (weak) and 1,808 (strong)
- Nasdaq 4,100 (weak) and 4,135 (strong) (includes morning drop not on chart)
- NYSE 10,080 (weak) and 10,160 (strong)
- Russell 1,138 (weak) and 1,146 (strong)
As you can see from Dave Fry's charts, we're not too far from a major breakdown but we've had some pretty good earnings and the Fed will not be likely to taper more tomorrow if the market is falling. We'll find out if these fairly minor pullbacks can hold. We've already made fantastic money to the downside, our Short-Term Portfolio, for example, which was up just $1,400 as of our January 23rd review, finished the day yesterday up $6,770 on against a $1,565 cost basis - up 332% on cash so far this year.

Though we preferred to stay mainly in cash, we did take some fairly aggressive bearish positions in anticipation of this sell-off. We left ourselves "cashy" (see review notes) so that we could take advantage of changing conditions.
These trades were also a counter-balance to our Long-Term Portfolio, which is almost entirely bullish and, despite yesterday's dip, managed to hang on to $2,440 worth of gains against a cash credit of $13,910, returning 117.5% of the cash should we decide to close it out early.

In the short-term, we're now getting oversold so it's a good time to form those shoulder patterns, though I'd prefer to see a nice blow-off bottom to buy into than us drifting back into our Thanksgiving levels.
8:30 Update: Our Durable Goods Orders for December were down 4.3%, a huge miss of the +1.6% expected by the Economorons who, for some reason, are still being asked what they think, despite these routine 600% misses of their estimates.
To be fair, ex-Transport, the result was only -1.6% vs +0.7% expects, so our "experts" were only off by 328% on the less volatile number. We had a big miss on New Home Sales yesterday as well (414,000 vs 457,000 expected) and, of course, when you look at the chart on the left, you can see how pathetic that is in the bigger picture.
As I've been saying all of last year, lack of a housing recovery means less jobs for all the lumberjacks and appliance makers and the tile makers and the hardware people and plumbers and electricians and movers and home builders and realtors and lawyers and bankers, etc. etc. It's a key component of our economy and it's still 50% below the pre-crash average. How can we possibly have a real recovery in this country if Housing looks like this?
We have Obama speaking today and the Fed tomorrow so we'll stay technical and just see what sticks this week. On Friday, one of our Members (Terrapin) asked me what hedge I recommended if the S&P couldn't hold 1,800 (and it didn't) and my trade idea was:
Hedge/Terra – Why didn't you ask me yesterday when TZA was my favorite? In the STP, we had 20 short Feb $16 puts at .55, and they were .60 yesterday but .35 now. I guess you can sell the March $16 puts for .75 and use that to buy the $17/21 bull call spread for 0.93 and then you're in the $4 spread for net 0.18 with 2,100% upside potential and TZA is already at $17.36 and $21 is up 23% or about an 11% drop on the S&P. Of course you could also use any short put on something you really want to buy if it gets cheaper, like CLF 2016 $18 puts at $4.20, which pays for 4.5 of the spreads each.
[Charts below from Finviz.com]
CLF will be taking off this morning but, as of yesterday's close, those 2016 $18 puts were still $4.50 and the TZA March $17/21 bull call spread was still "just" $1.30 (up 39%) so, if you were willing to sell 10 of the puts for $4,500, you could afford to buy 40 of the spreads ($5,200) for net $700. The potential upside would be $16,000, for a 2,185% return on cash in 52 days at TZA $21 and the worst-case to the downside is you lose $700 and own 1,000 shares of CLF at $18 ($1,800).
Overall, that TZA spread with the more aggressive short puts (now .48) is net .82 and that's up 355% in 2 days and THAT is how we hedge the markets!


Comments
Log in or sign up to join the conversation.