

The good news is:
The next 2 weeks have been seasonally strong.
Last week there was a retest of the October lows that was not confirmed by new lows.
The Negatives
New lows remained at threatening levels on both exchanges all week.
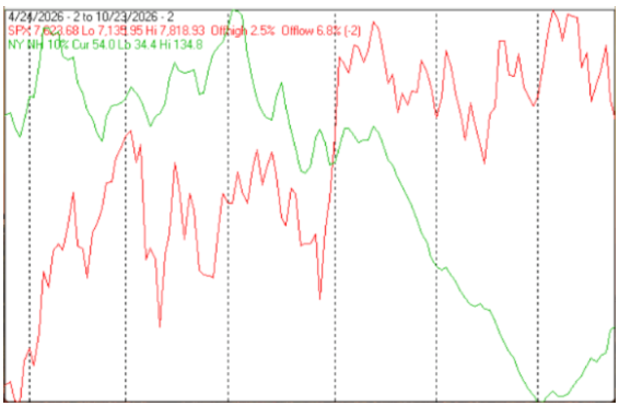
The first chart covers the past 6 months showing the S&P 500 (SPX) in red and a 40% trend (4 day EMA) of NYSE new highs divided by new highs + new lows (NY HL Ratio), in blue. Dashed vertical lines have been drawn on the first trading day of the month. Dashed horizontal lines have been drawn at 10% levels for the indicator; the line is solid at the 50%, neutral, level.
NY HL Ratio continued sharply downward last week and is oversold by any measure. Also, by a small margin, it did not confirm the price low.
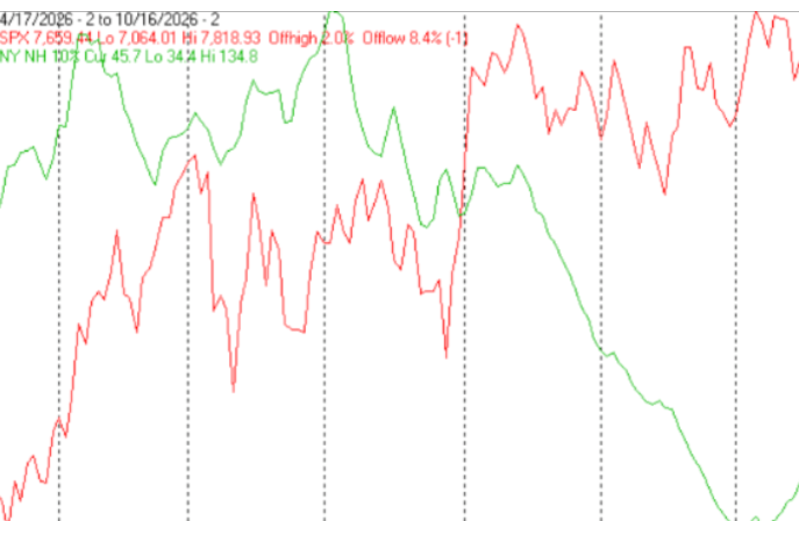
The next chart is similar to the one above except it shows the Nasdaq composite (OTC) in blue and OTC HL Ratio, in red, has been calculated with Nasdaq data.
OTC HL Ratio is also oversold and did not confirm (by a small margin) the new low in the index.
The Positives
The next chart covers the past 6 months showing the OTC in blue and a 10% trend of Nasdaq new lows (OTC NL) in brown. OTC NL has been plotted on an inverted Y axis so diminishing numbers of new lows move the indicator upward (up is good).
For the 2nd week, OTC NL did not confirm falling prices.
The next chart is similar to the one above except it shows the SPX in red and NY NL, in blue, has been calculated with NYSE data.
NY NL also did not confirm the new price low.
Seasonality
Next week includes the last 5 trading days of November during the 2nd year of the Presidential Cycle. The tables below show the daily change, on a percentage basis for that period.
OTC data covers the period from 1963 to 2018 while SPX data runs from 1928 to 2018. There are summaries for both the 2nd year of the Presidential Cycle and all years combined.
Average returns for the coming week have been positive by all measures.
Last 5 days of November.
The number following the year represents its position in the Presidential Cycle.
The number following the daily return represents the day of the week;
1 = Monday, 2 = Tuesday etc.
OTC Presidential Year 2
Day5 Day4 Day3 Day2 Day1 Totals
1966-2 -0.42% 3 0.18% 5 0.26% 1 0.86% 2 -0.24% 3 0.64%
1970-2 0.47% 1 0.28% 2 0.31% 3 0.25% 5 1.34% 1 2.66%
1974-2 0.94% 5 -0.63% 1 1.57% 2 0.24% 3 0.24% 5 2.37%
1978-2 0.69% 5 -0.17% 1 -0.32% 2 -1.31% 3 0.53% 4 -0.58%
1982-2 -0.27% 2 0.76% 3 0.78% 5 -0.11% 1 1.72% 2 2.87%
1986-2 0.70% 5 0.41% 1 0.24% 2 0.34% 3 0.40% 5 2.08%
1990-2 -0.05% 1 1.49% 2 0.29% 3 0.19% 4 0.93% 5 2.85%
1994-2 -0.61% 3 0.79% 5 0.43% 1 0.77% 2 -0.15% 3 1.23%
Avg 0.09% 0.65% 0.28% -0.02% 0.68% 1.69%
1998-2 2.57% 1 -0.58% 2 0.88% 3 1.65% 5 -3.31% 1 1.21%
2002-2 0.08% 5 0.90% 1 -2.53% 2 3.01% 3 -0.62% 5 0.85%
2006-2 -0.23% 5 -2.21% 1 0.28% 2 0.81% 3 -0.02% 4 -1.37%
2010-2 -1.46% 2 1.93% 3 -0.34% 5 -0.37% 1 -1.07% 2 -1.31%
2014-2 0.24% 5 0.89% 1 0.07% 2 0.61% 3 0.09% 5 1.90%
Avg 0.24% 0.19% -0.33% 1.14% -0.99% 0.26%
OTC summary for Presidential Year 2 1966 - 2014
Averages 0.20% 0.31% 0.15% 0.54% -0.01% 1.18%
% Winners 54% 69% 77% 77% 54% 77%
MDD 11/30/1998 3.31% -- 11/26/2002 2.53% -- 11/27/2006 2.44%
OTC summary for all years 1963 - 2017
Averages 0.29% 0.24% 0.14% 0.34% -0.02% 0.99%
% Winners 56% 57% 67% 69% 64% 71%
MDD 11/30/2000 10.55% -- 11/30/1987 3.97% -- 11/30/1973 3.91%
SPX Presidential Year 2
Day5 Day4 Day3 Day2 Day1 Totals
1930-2 0.29% 1 -1.17% 2 -1.42% 3 -1.38% 5 1.16% 6 -2.53%
1934-2 1.29% 6 1.38% 1 -0.95% 2 1.17% 3 0.00% 5 2.90%
1938-2 0.16% 5 -1.40% 6 -2.14% 1 0.49% 2 2.41% 3 -0.49%
1942-2 -0.21% 2 -0.43% 3 0.32% 5 0.00% 6 -0.54% 1 -0.85%
1946-2 -0.14% 1 0.98% 2 0.69% 3 0.89% 5 -0.07% 6 2.36%
1950-2 -0.20% 6 -0.49% 1 -3.07% 2 -0.97% 3 0.72% 4 -4.01%
1954-2 1.34% 2 0.56% 3 0.96% 5 -0.03% 1 -0.87% 2 1.97%
Avg 0.19% -0.16% -0.65% 0.08% 0.33% -0.21%
1958-2 -0.96% 5 -2.60% 1 -0.60% 2 1.72% 3 1.12% 5 -1.32%
1962-2 -0.29% 1 0.60% 2 0.63% 3 0.47% 4 -0.24% 5 1.17%
1966-2 0.68% 3 0.80% 5 -0.17% 1 -0.36% 2 0.04% 3 0.98%
1970-2 0.62% 1 0.64% 2 0.37% 3 0.99% 5 1.48% 1 4.09%
1974-2 1.06% 5 -0.10% 1 0.93% 2 0.68% 3 0.04% 5 2.60%
Avg 0.22% -0.13% 0.23% 0.70% 0.49% 1.51%
1978-2 0.32% 5 0.21% 1 -0.88% 2 -1.47% 3 1.01% 4 -0.80%
1982-2 -0.96% 2 0.71% 3 0.75% 5 -0.50% 1 3.23% 2 3.23%
1986-2 1.57% 5 0.65% 1 0.29% 2 0.24% 3 0.18% 5 2.93%
1990-2 0.45% 1 0.50% 2 -0.05% 3 -0.48% 4 1.83% 5 2.25%
1994-2 -0.03% 3 0.52% 5 0.41% 1 0.22% 2 -0.33% 3 0.80%
Avg 0.27% 0.52% 0.11% -0.40% 1.19% 1.68%
1998-2 2.12% 1 -0.44% 2 0.33% 3 0.45% 5 -2.41% 1 0.06%
2002-2 -0.34% 5 0.25% 1 -2.10% 2 2.80% 3 -0.27% 5 0.33%
2006-2 -0.37% 5 -1.36% 1 0.35% 2 0.92% 3 0.08% 4 -0.37%
2010-2 -1.43% 2 1.49% 3 -0.75% 5 -0.14% 1 -0.61% 2 -1.43%
2014-2 0.52% 5 0.29% 1 -0.12% 2 0.28% 3 -0.25% 5 0.72%
Avg 0.10% 0.05% -0.46% 0.86% -0.69% -0.14%
SPX summary for Presidential Year 2 1930 - 2014
Averages 0.25% 0.07% -0.28% 0.27% 0.35% 0.66%
% Winners 55% 64% 50% 59% 55% 64%
MDD 11/29/1950 4.68% -- 11/25/1958 4.12% -- 11/28/1930 3.93%
SPX summary for all years 1928 - 2017
Averages 0.10% 0.14% 0.03% 0.04% 0.19% 0.50%
% Winners 56% 62% 51% 56% 55% 53%
MDD 11/28/1931 7.09% -- 11/30/1987 6.53% -- 11/29/1950 4.68%
Conclusion
There was a retest of the late October lows which was not confirmed by the new low indicators. Seasonality is strong for the next 2 weeks.
I expect the major averages to be higher on Friday, November 30 than they were on Friday, November 23.
Early last week the market retested the late October lows before heading upward as per the Seasonal pattern. I am calling last weeks positive forecast a loss.
Comments
Log in or sign up to join the conversation.