

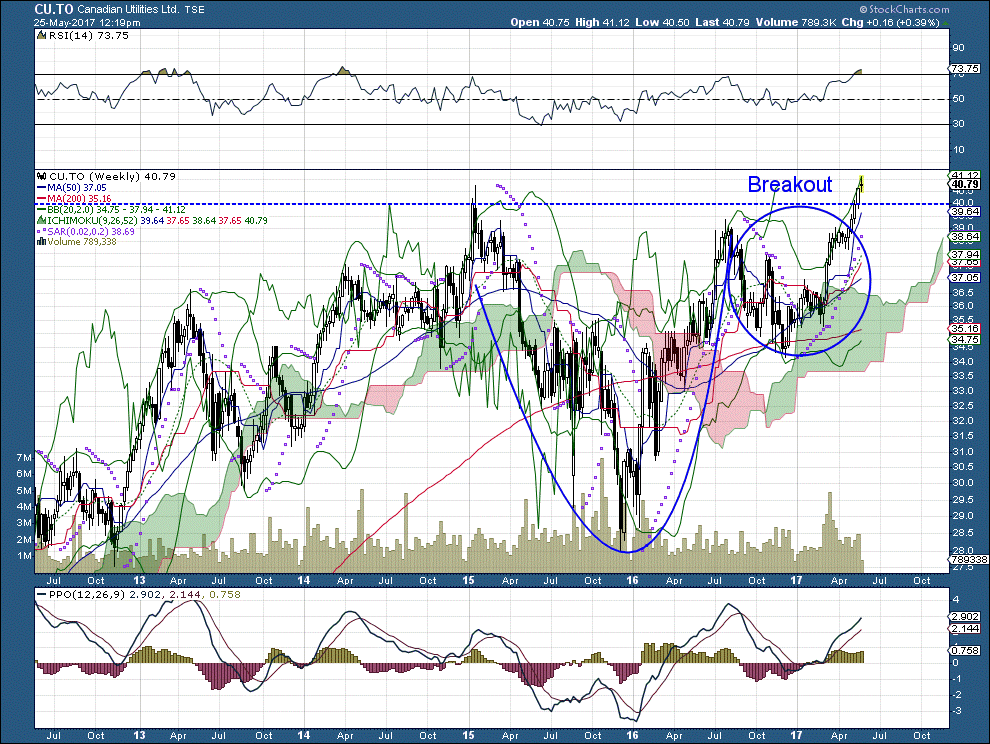
If you’ve read many of my columns, you will know that the cup-and-handle pattern is one of my favourites. Above, you will see it in spades. But the message in this five-year chart is that there has been little real movement in the chart – until the last couple of weeks, that is. It is only now that we are seeing a breakout above the highs of two and a half years ago.
What’s behind this activity? According to the company’s most recent financials, its net income grew by 20.91% in the last 12 months, C$0.79 per share during the most recently completed quarter. This represented a net profit margin of 18.82%.
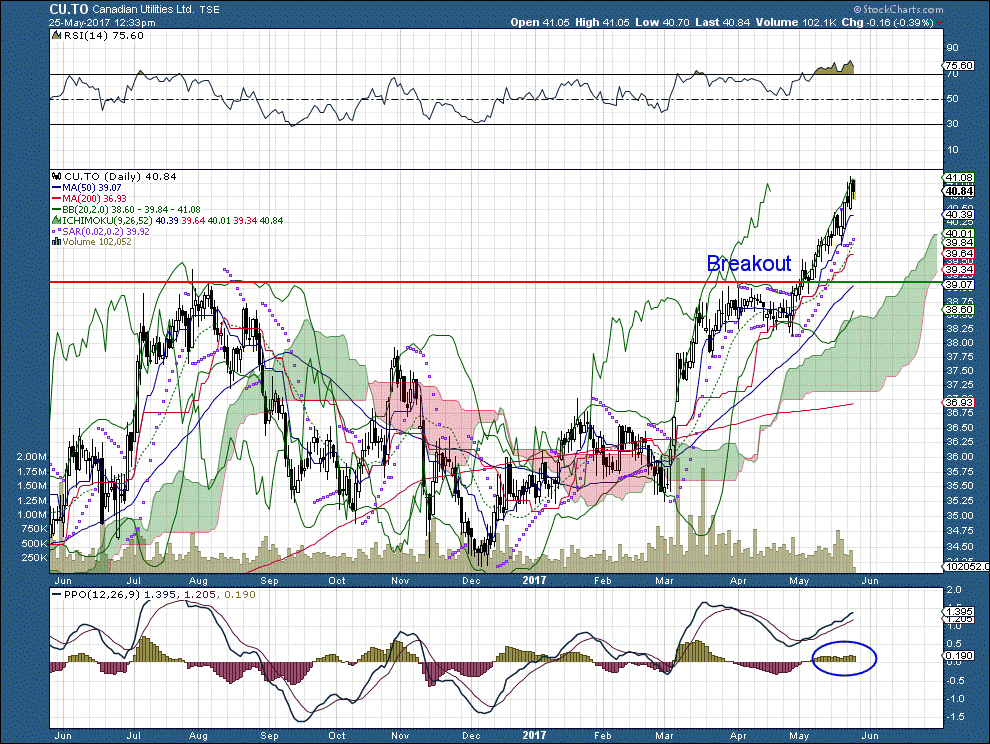
Of course, in my world it’s the charts that tell the story. Above is a one year chart of the company. In this case, I have used the company’s high from last August as the breakout point. It clearly is a breakout, but what’s really important here is to see that Canadian Utilities is not only experiencing a short-term breakout. The activity of the last week is also punching through the highs set at the beginning of 2015.
I find this convincing, and I’m quite long on the stock.

Comments
Log in or sign up to join the conversation.