
Per the request of an NFTRH subscriber who has been using these vehicles (Teck & Vale) to ride an ‘inflation trade’ scenario we have been discussing. Also for anyone else with an interest...
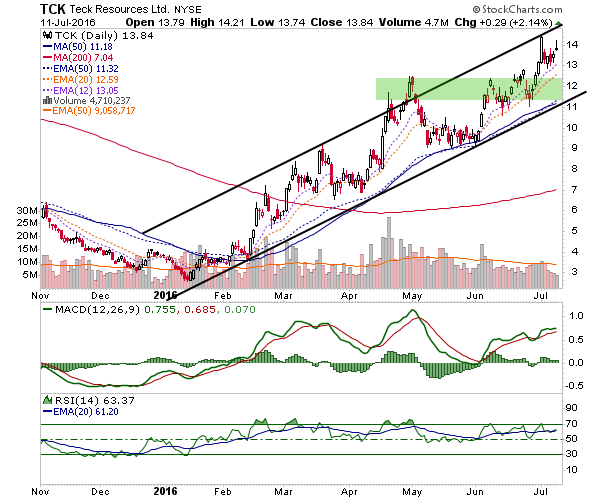
TCK daily is in a firm uptrend, with key support at the lower channel line and 50 day moving averages just above 11.
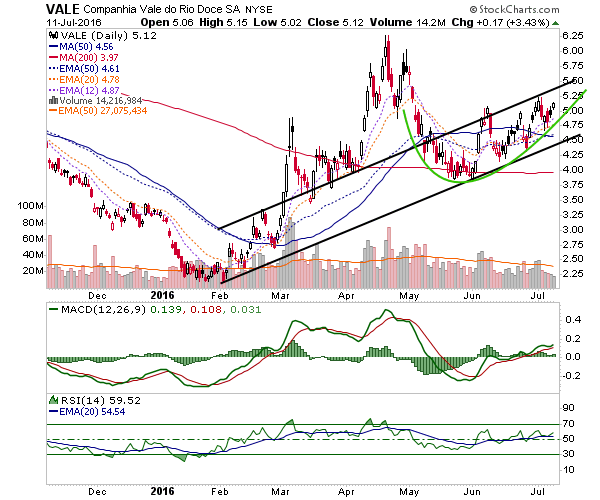
VALE daily is curving upward in a manner that I would not be surprised to see form a short-term, bullish Cup & Handle. As with TCK, the 50 day averages are a key support area (around 4.50).
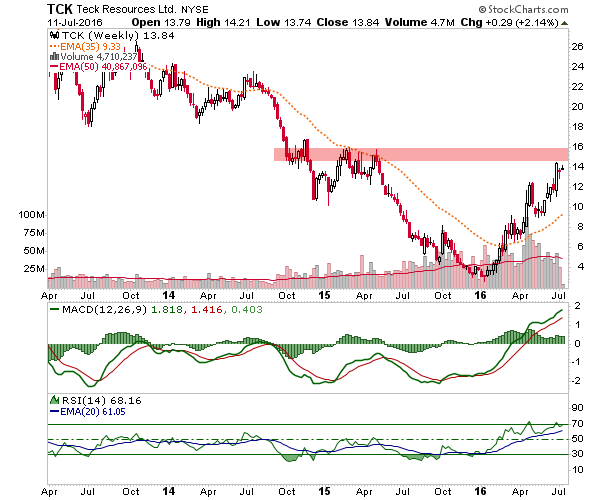
TCK weekly shows a clear resistance zone upcoming. The thing has gone from 4 to 14, after all. Additional support is 9-10.
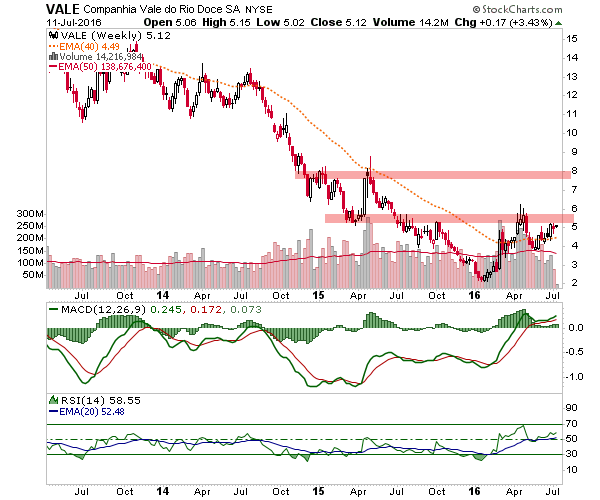
VALE weekly is not nearly so extended, but is also approaching resistance. If it gets through 6, the next target is 8-9. Support is the same 4.50 as shown on the daily (EMA 40).


Comments
Log in or sign up to join the conversation.