

Taiwan Semiconductor (TSM) reported strong Q2 revenue, with high net income and free cash flow (FCF) margins. However, TSM stock is down, giving value investors an opportunity. One play is to sell short OTM puts.
TSM closed down 2.3% on Thursday, July 16, at $409.74, after releasing its Q2 earnings before the market opened, but then rose afterwards. It's also down 14.2% from its peak price of $477.57 on June 30. However, given its strong showing in Q2, TSM could be worth much more, as I will show in this article.
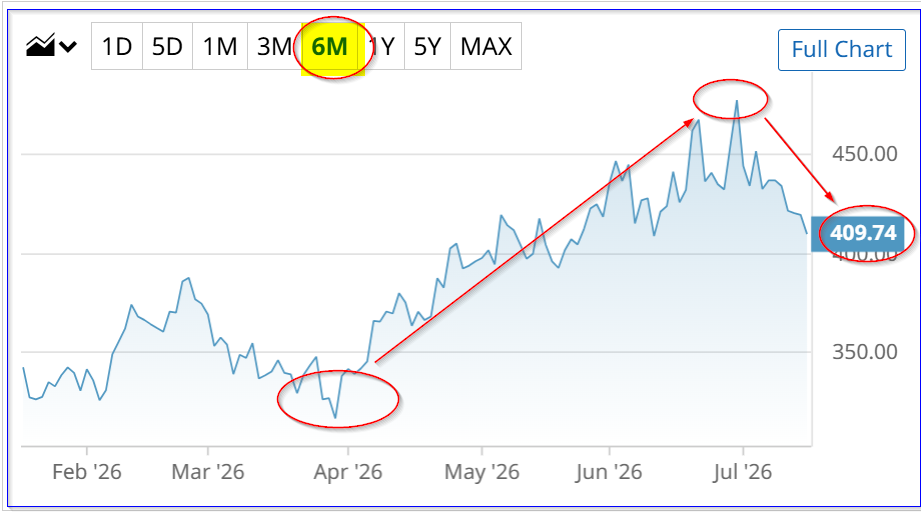
TSM stock - last 6 months - Barchart - As of July 16, 2026
Strong Q2 Earnings and Cash Flow
Taiwan Semiconductor is at the heart of the AI investment boom as the world's largest semiconductor chip maker. Its chips are now being made in Phoenix, Arizona (where I live and I've seen its huge plant) and around the world, not just in Taiwan.
In fact, the company is now going to invest another $100 billion in new plant upgrades in Arizona, on top of the $165 billion it has already spent there.
This is easily funded by its existing operational cash flow. For example, in the first half of 2026, TSM generated $46.9 billion in operating cash flow. That represents a 61.6% margin on its first revenue of $76.1 billion, as seen on page 4 of its financial presentation.
Moreover, analysts project revenue will rise 40% this year to $168.4 billion. Therefore, at this margin, it could generate $103.7 billion in operating cash flow (i.e., $168.4 billion x 0.616). That could fund $100 billion in capex over one year.
In the first half of this year, TSM had $26.8 billion in capex, or about 57% of its H1 operating cash flow of $46.9 billion. That resulted in $20.1 billion in free cash flow (FCF), or 26.4% of H1 revenue.
In other words, TSM could easily afford to spend $100 billion over the next two years, i.e., by generating $103.7 billion in operating cash flow annually and $44.5 billion in FCF (i.e., 26.4% x $168.4 billion in 2026 revenue).
It also implies that TSM could be worth considerably more. Let's look at that.
FCF Projections and Fair Market Value Estimates
Next year's revenue could rise to $213.29 billion, based on Seeking Alpha's survey of analysts. That's up +26.7% over 2026 revenue forecasts. It also means that over the next 12 months (NTM), revenue would average $190.85 billion.
Therefore, using a 61.6% operating cash flow margin and deducting 57% in capex, shows that NTM free cash flow (FCF) could rise to $50.6 billion (up from $44.5 billion projected this year).
As a result, the fair market value (FMV) for TSM stock could be much higher. For example, right now, TSM has a market cap of $2,125 billion ($2.126 trillion), according to Yahoo! Finance.
Therefore, using a run-rate FCF estimate of $40.2 billion (i.e., $20.1b in H1 x 2), the stock has an FCF yield of 1.89%. So, applying that to my NTM FCF estimate, the FMV is higher:
$50.6b NTM FCF / 0.0189 = $2,677 billion ($2.677 trillion) FMV
That is 26% higher than TSM's market cap today of $2.125 trillion. In other words, the price target (PT) is 26% higher:
$409.76 x 1.26 = $516.30 PT
Other analysts agree that TSM is undervalued. For example, Yahoo! Finance's average PT is $498.24 billion from 19 analysts. And Barchart's mean survey price is $463.92.
The bottom line is that TSM looks undervalued after its Q2 earnings release.
However, there is no guarantee the stock will rise to these targets. Therefore, one conservative way to play it is to short out-of-the-money (OTM) put options.
Shorting OTM TSM Puts
The August 21 expiry period, just over a month from today, has an attractive play for value investors. It shows that an investor can make a good yield shorting puts that are well below today's price (i.e., “out-of-the-money” or OTM). Moreover, the investor can achieve a potentially lower buy-in point.
For example, the $370.00 strike price put option contract has a midpoint premium of $9.80. That strike price is $39.74 below Thursday's close, i.e., 9.80% out-of-the-money.
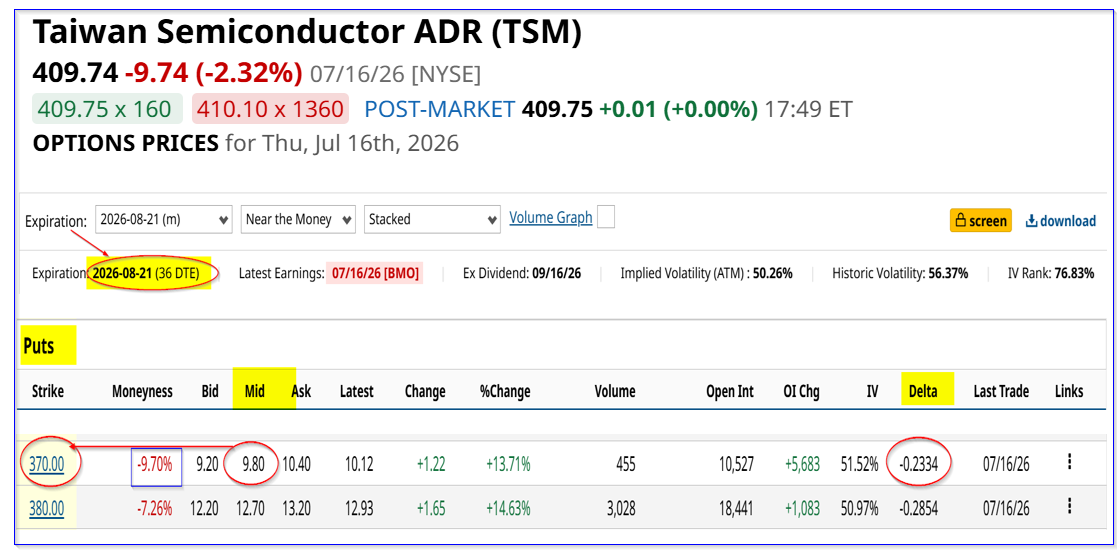
TSM puts expiring Aug. 21 - Barchart - As of July 16, 2026
So, an investor who enters an order to “Sell to Open” this strike price, after posting collateral of $37,000 (i.e., 100 shares per contract x $370.00), immediately collects $980.00 (i.e., $9.80 x 100).
That works out to a one-month yield of almost 2.65% (i.e., $980/$37,000 = 0.026485).
Moreover, even if TSM drops 10% to $370.00, the investor's net breakeven point is $360.20 (i.e., $370.00 - 9.80). That is 49.54 below Thursday's close, or 12% lower. That is an attractive buy-in.
One reason is that there is only a 23% chance this will occur, based on the delta ratio. Second, if TSM later hits my price target (see above), the expected return (ER) is over 43% (i.e., $516.30/$360.20 -1 = 0.433, or +43.4% upside).
The bottom line is that TSM looks cheap here. One attractive play is to short out-of-the-money (OTM) puts in one-month expiry periods.



Comments
Log in or sign up to join the conversation.