
T2108 Status: 57.6%
T2107 Status: 26.2%
VIX Status: 18.0
General (Short-term) Trading Call: Neutral (target of 1996 on the S&P 500 occurred ahead of overbought conditions. See “From the Edge of A Breakout to the Ledge of A Breakdown” for more details).
Active T2108 periods: Day #9 over 20%, Day #8 over 30%, Day #8 over 40%, Day #6 over 50% (overperiod), Day #2 under 60%, Day #323 under 70%
Reference Charts (click for view of last 6 months from Stockcharts.com):
S&P 500 or SPY
SDS (ProShares UltraShort S&P500)
U.S. Dollar Index (volatility index)
EEM (iShares MSCI Emerging Markets)
VIX (volatility index)
VXX (iPath S&P 500 VIX Short-Term Futures ETN)
EWG (iShares MSCI Germany Index Fund)
CAT (Caterpillar).
IBB (iShares Nasdaq Biotechnology).
Commentary
T2108 faded further away from overbought conditions. The third pullback in a row accompanied the S&P 500 (SPY) down to an early test of the 50DMA as support.
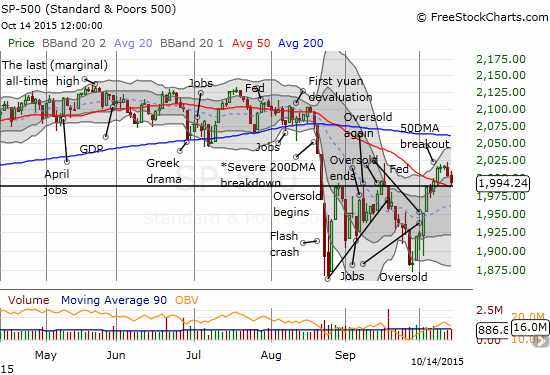
The S&P 500 (SPY) has drifted back to its 50DMA
While the 50DMA test looks mild, it is important. The S&P 500 topped out at the September intraday high and thus has yet to completely heal from the oversold periods that began in the August angst. A breakdown here opens the potential for yet another trip to oversold conditions. A successful test would setup a run-up to 200DMA resistance which SHOULD finally create overbought conditions. It could be a very close call…like the Pittsburgh Steelers going for the win instead of the tie against the San Diego Chargers on Monday Night Football and getting rewarded as running back Le’Veon Bell stretches at the final tick of the game for the winning touchdown.
It was a day of earnings news that featured at least two stark contrasts. Intel (INTC) dropped as much as 3.7% in the morning, and I began contemplating my first post-earnings buy perhaps around a 50DMA test. Before I could think a second thought, INTC jumped back up to a 1.5% gain on its way to a remarkable +2.4% gain. Suddenly, INTC has successfully defended the 200DMA as support and looks ready to resume its breakout.
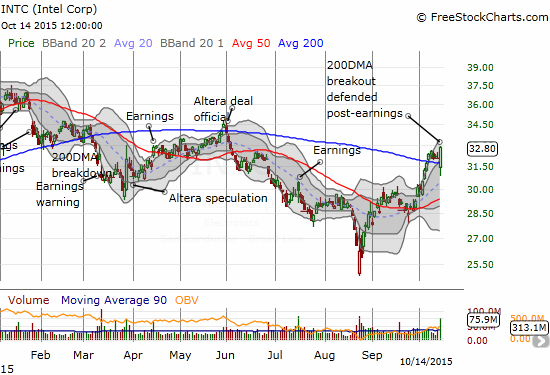
Intel (INTC) bounces back aggressively after initial post-earnings selling.
There was no bounceback for Wal-Mart (WMT). WMT shocked the market with a deep earnings warning that sent the stock cratering to a 10.0% loss on the day. The daily chart below is a great example of the importance of respecting trends. Clearly, there were lots of sellers eager to get out of the way of just such a moment on WMT.
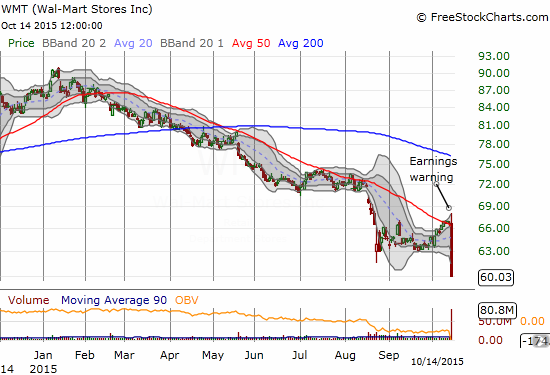
Wal-Mart plunged to its biggest 1-day loss in 27 years
WMT now trades at prices last seen in mid-2012. The prospect of further selling as the market prices in the poor outlook confirms the end of WMT’s big breakout in 2012. There is even the real possibility that WMT will return to a trading range that was in place from 1999 to 2012.
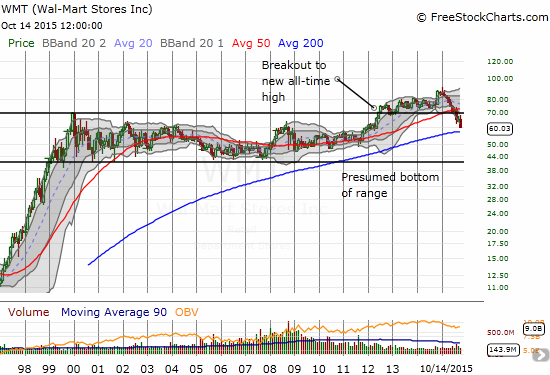
The breakout for Wal-Mart has definitely ended. Time to resume the previous trading range that began in 1999?!?
Even though WMT’s news sounded very company-specific, I was still surprised that there was no general market malaise. After all, if WMT cannot make good money when gas prices are at rock-bottom prices and unemployment is just about as low as it will go, who can? And what happens when these tailwinds for the consumer start to fade? For now, it seems these are not concerns for the general market.
SPDR S&P Retail ETF (XRT) DID feel the impact and was a relatively poor performer on the day with a 1.0% loss. It is an ominous confirmation of the 50DMA as resistance. Traders must closely watch this development.
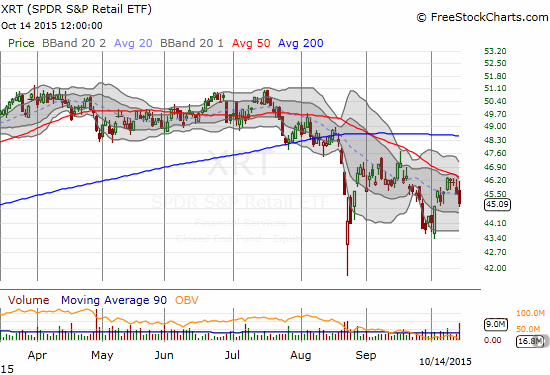
SPDR S&P Retail ETF (XRT) has been guided downward by its 50DMA since August
Daily T2108 vs the S&P 500

Black line: T2108 (measured on the right); Green line: S&P 500 (for comparative purposes)
Red line: T2108 Overbought (70%); Blue line: T2108 Oversold (20%)
Weekly T2108

*All charts created using freestockcharts.com unless otherwise stated
Be careful out there!

Comments
Log in or sign up to join the conversation.