

(T2108 measures the percentage of stocks trading above their respective 40-day moving averages [DMAs]. It helps to identify extremes in market sentiment that are likely to reverse. To learn more about it, see my T2108 Resource Page. You can follow real-time T2108 commentary on twitter using the #T2108 hashtag. T2108-related trades and other trades are occasionally posted on twitter using the #120trade hashtag. T2107 measures the percentage of stocks trading above their respective 200DMAs)
T2108 Status: 39.9%
T2107 Status: 19.2%
VIX Status: 22.3
General (Short-term) Trading Call: bullish
Active T2108 periods: Day #3 over 20%, Day #2 over 30% (overperiod), Day #47 under 40%, Day #51 below 50%, Day #66 under 60%, Day #407 under 70%
Commentary
On January 28, 2016, Facebook (FB) gained 15.5% in a post-earnings move that I described as “full bull.” The bullishness of the day was confirmed when T2108 finally exited an excruciating oversold period the following day. I am calling this day: “Full Bull (FB) Part Two” because FB has recovered from a near complete reversal of all its post-earnings gain to close above its 50-day moving average. This bullish move comes after six straight trading days testing and retesting resistance at the 50DMA only to get turned back.
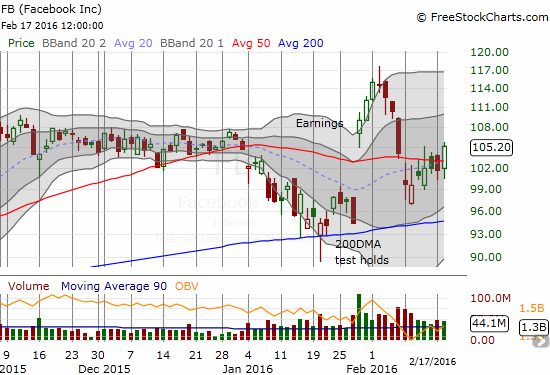
This close-up of Facebook (FB) shows how the stock almost gave up its entire monster post-earnings gain and then struggled mightily to fight 50DMA resistance. The close above resistance positions FB to make a fresh run to regain its post-earnings luster.
The road ahead to confirm FB’s bullish move will not (should not?) be nearly as easy as Full Bull Part One. On the positive side, T2108 soared for a third straight day demonstrating broad participation in this current bounce from oversold trading conditions. At 39.9%, T2108 closed exactly at the peak of December’s bounce from oversold conditions.
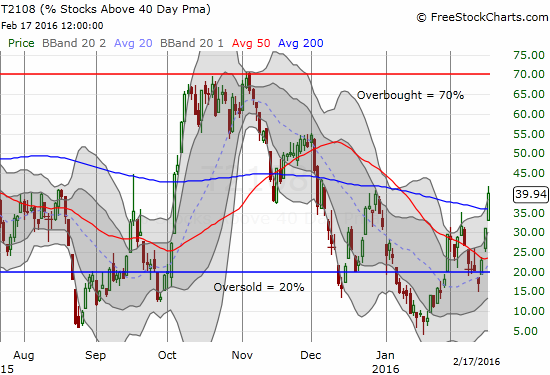
T2108 is putting on an impressive display of strength. Can it now hurdle over critical resistance and FINALLY close above 40%?
T2108 is right at critical resistance just as other key indicators are at critical testing points.
The S&P 500 (SPY) printed its first 3-day gain since December. The index is staring down resistance from the last high in late January.
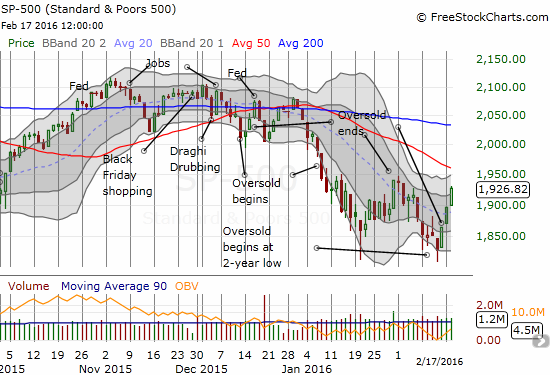
The S&P 500 has finally strung together an impressive 3-day rally. Resistance is directly overhead from January’s high and the downtrending 50DMA.
The volatility index, the VIX, is also facing an important test; this is a test of support.
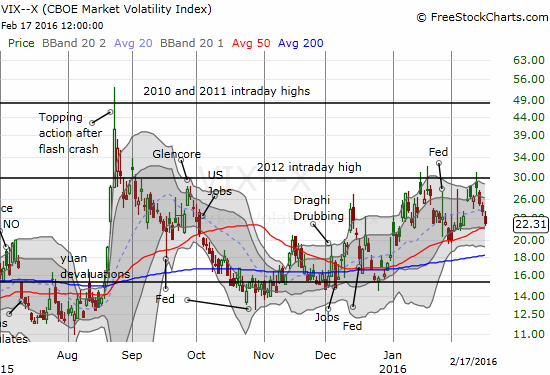
If the VIX survives this test of support, it will likely be time to brace for a freshly imminent sell-off in the stock market.
I used this further plunge in volatility to lock in profits on my put options on ProShares Ultra VIX Short-Term Futures (UVXY).
This continued rally surprised me because overnight trading going into the U.S. session featured a resurgent Japanese yen (FXY) and weakening Australian dollar (FXA). For whatever reason, they both turned around and delivered a supportive rally in AUD/JPY. Note however, the recovery was NOT complete and, like the S&P 500, AUD/JPY faces resistance from a rapidly declining 50DMA.
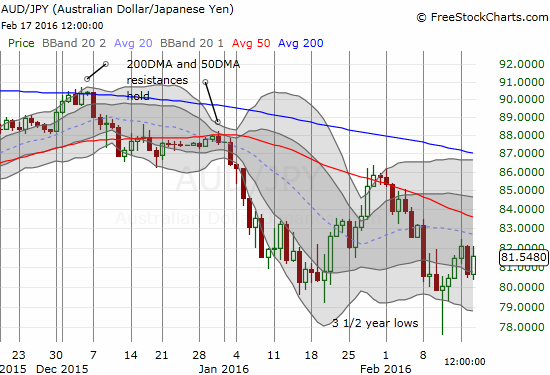
AUD/JPY recovers from a bearish drawdown but has not quite provided a freshly bullish signal.
I will conclude here with a chart of Tesla Motors (TSLA). This is one of similar charts of individual stocks surging from recent lows. This move surprised me as I expected TSLA to struggle like other big stocks in the wake of their earnings. Instead, TSLA showed off some of its old flair with a monster 8.7% gain which looks to erase the bad taste of a 2-year low. TSLA is in the open field with a fresh post-earnings high, a fully bullish move.
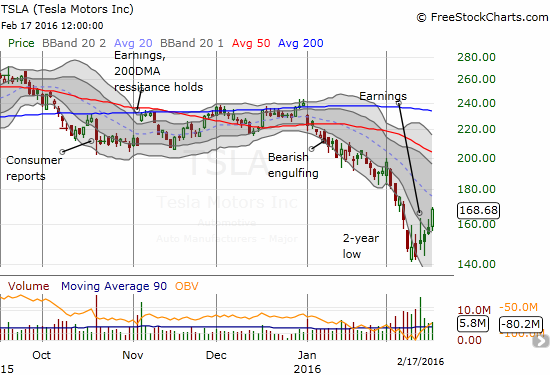
Tesla Motors (TSLA) is soaring again.
Daily T2108 vs the S&P 500
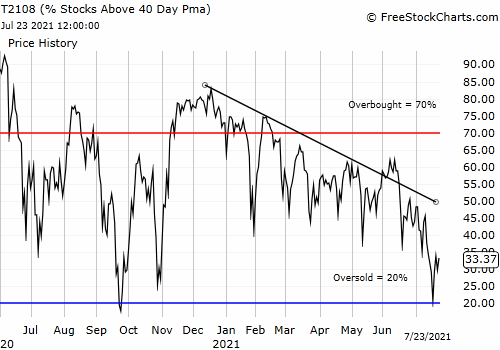
Black line: T2108 (measured on the right); Green line: S&P 500 (for comparative purposes)
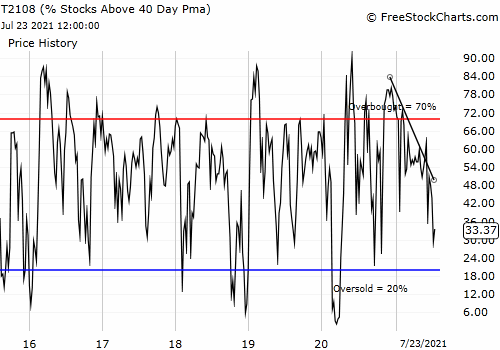
Red line: T2108 Overbought (70%); Blue line: T2108 Oversold (20%)
Weekly T2108

Comments
Log in or sign up to join the conversation.