

(T2108 measures the percentage of stocks trading above their respective 40-day moving averages [DMAs]. It helps to identify extremes in market sentiment that are likely to reverse. To learn more about it, see my T2108 Resource Page. You can follow real-time T2108 commentary on twitter using the #T2108 hashtag. T2108-related trades and other trades are occasionally posted on twitter using the #120trade hashtag. T2107 measures the percentage of stocks trading above their respective 200DMAs)
T2108 Status: 39.8%
T2107 Status: 20.1%
VIX Status: 20.5
General (Short-term) Trading Call: bullish
Active T2108 periods: Day #4 over 20%, Day #3 over 30% (overperiod), Day #48 under 40% (underperiod), Day #52 below 50%, Day #67 under 60%, Day #408 under 70%
Commentary
T2108, the percentage of stocks trading above their respective 40-day moving averages (DMAs), remained as steady as the S&P 500 (SPY) to close last week. T2108 was flat at 39.8%. Buyers picked the S&P 500 off its lows for the day to get a flat close and a strong week overall. T2107, the percentage of stocks trading above their respective 200DMAs, managed to close up in a small positive sign.
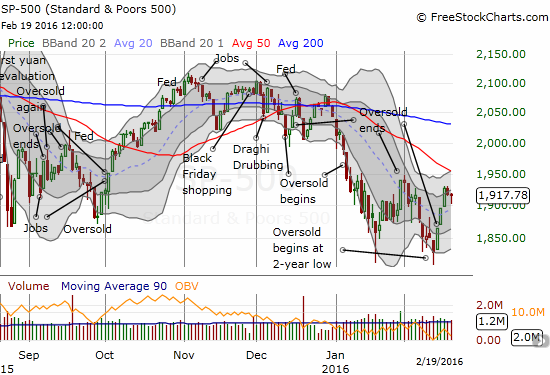
The S&P 500 looks like it is trying to hold onto its strong bounce out of oversold conditions.
Interestingly, the volatility index made a much more dramatic move with a fade from highs that resulted in a definitive breakdown below its 50DMA. This move breaks the recent uptrend. This is a significant development that could support further market gains.
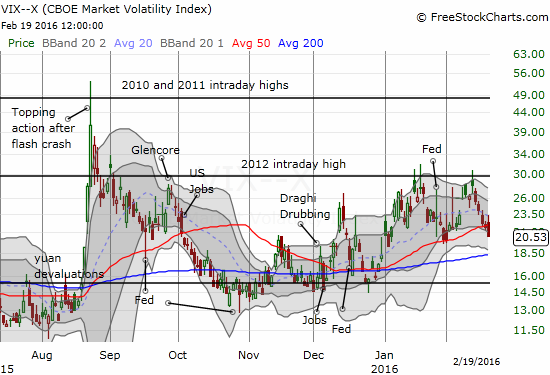
The volatility index has struggled mightily to push past the intraday high of 2012 even as market fears have presumably skyrocketed.
This week sets up well as a major test of the market’s ability to sustain post-oversold momentum. Here are some charts that have my attention going into this week. These are all the kinds of “recovery” stocks that get more and more interesting, the firmer the bounce from the S&P 500’s oversold conditions.
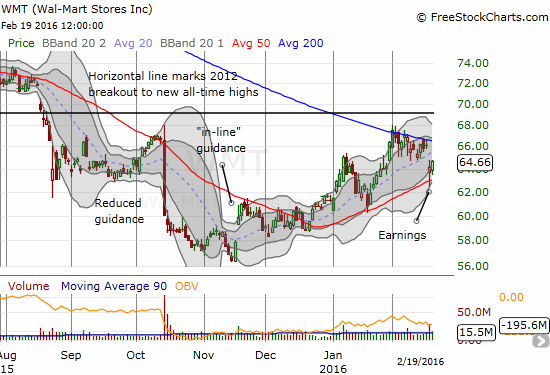
Wal-Mart Stores (WMT) failed to deliver the goods and vindicate all the recent buying. The support at the 50DMA is encouraging, but 200DMA resistance could stiffen further.
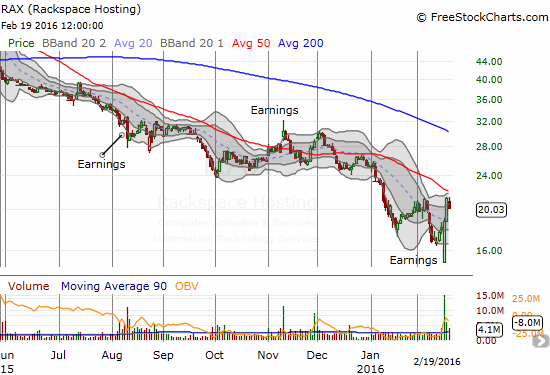
Rackspace Hosting (RAX) is already up 33% from its post-earnings intraday low. Some consolidation below 50DMA resistance could set the stock up for a major breakout.
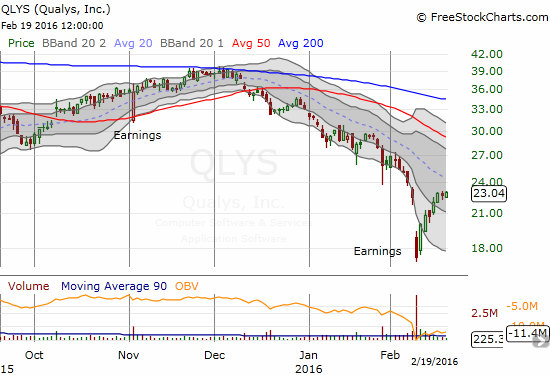
I have had my eye on Qualys, Inc. (QLYS) but missed the classic trade to fade an over-extension below the lower-Bollinger Band (BB). A break of the 20DMA downtrend could signal/confirm a bottom.
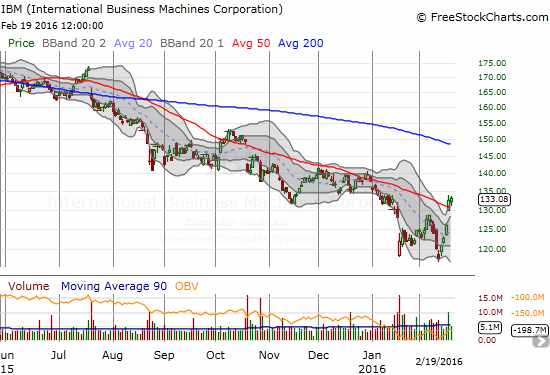
International Business Machines (IBM) has had a rough time for a very long time. Over the past week, IBM rocketed off a near 6-year low to break out above its 50DMA. Is THIS the breakout that finally sticks?
Daily T2108 vs the S&P 500
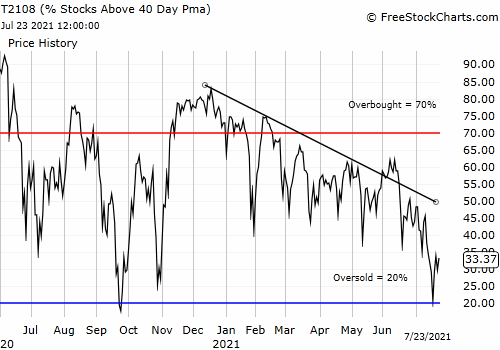
Black line: T2108 (measured on the right); Green line: S&P 500 (for comparative purposes)
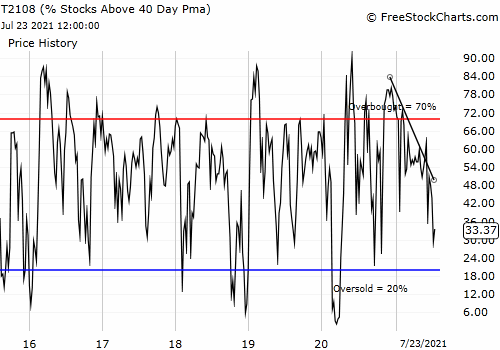
Red line: T2108 Overbought (70%); Blue line: T2108 Oversold (20%)
Weekly T2108


Comments
Log in or sign up to join the conversation.