

Drop in GDP trajectory, rise in inflation expectations, and expected long rates up.
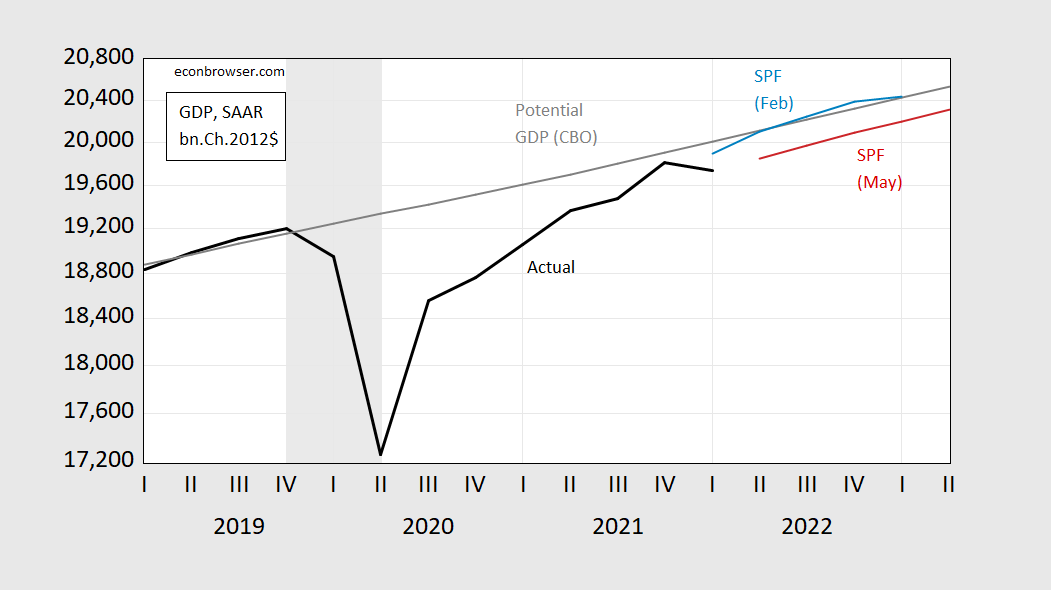
Figure 1: GDP (black), February Survey of Professional Forecasters mean GDP (blue), May (red), CBO potential GDP (gray). NBER defined peak-to-trough recession dates shaded gray. Source: BEA, SPF (various issues), CBO (July 2021), and NBER.
Interestingly, if one believes in CBO’s July estimates of potential (new ones out on May 25), then we’re nowhere near full employment, and given the May Survey, not likely to come close soon.
As inflation has increased, near term inflation forecasts have risen – but continue to converge to at lower levels. The May survey tags the 2023Q2 rate at 3%, up from the February survey for 2023Q1 at 2.5%
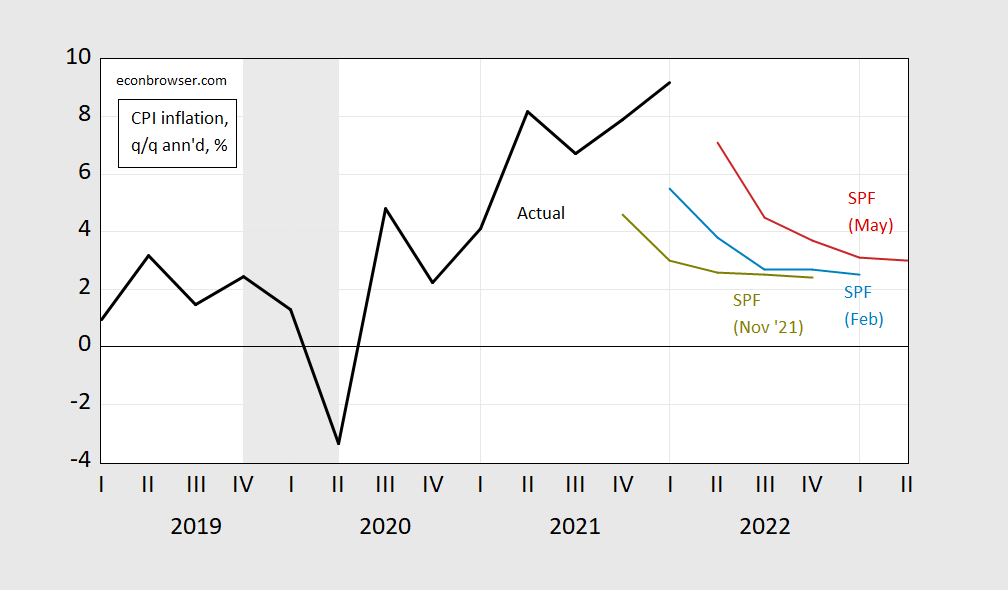
Figure 2: Quarter-on-quarter annualized CPI inflation (black), November 2021 Survey of Professional Forecasters mean inflation (chartreuse), February 2022 (blue), May (red), CBO potential GDP (gray). NBER defined peak-to-trough recession dates shaded gray. Source: BLS, SPF (various issues), and NBER.
Higher inflation with a persistent (negative) output gap suggests that demand pull is not the only reason for accelerated inflation. Of course, the estimate of potential could be too high, in which case demand pull would be the interpretation. But if potential is as shown above, then inflation is at least in part cost-push.
Long term (10 year) Treasury yields are now slated to be substantially higher, reflecting the jump in actual rates since the February survey.
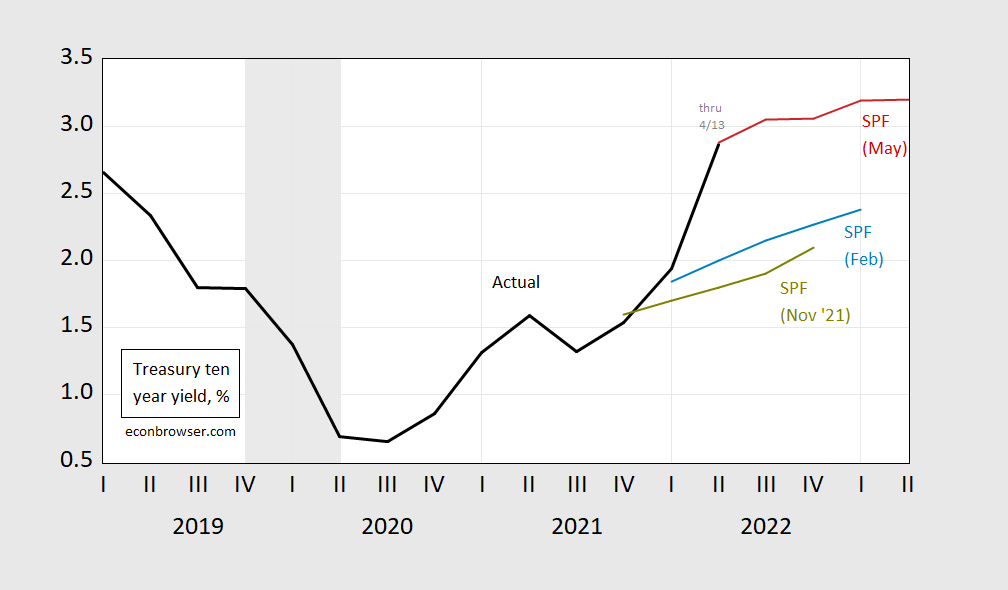
Figure 3: Ten year Treasury yields (black), November 2021 Survey of Professional Forecasters mean inflation (chartreuse), February 2022 (blue), May (red). 2022Q2 actual yield is through 5/13. NBER defined peak-to-trough recession dates shaded gray. Source: Treasury, SPF (various issues), and NBER.



Comments
Log in or sign up to join the conversation.