

As has been noted, the surge in goods demand is part of the story for why shortages and price pressures have mounted. Here’s another illustration.
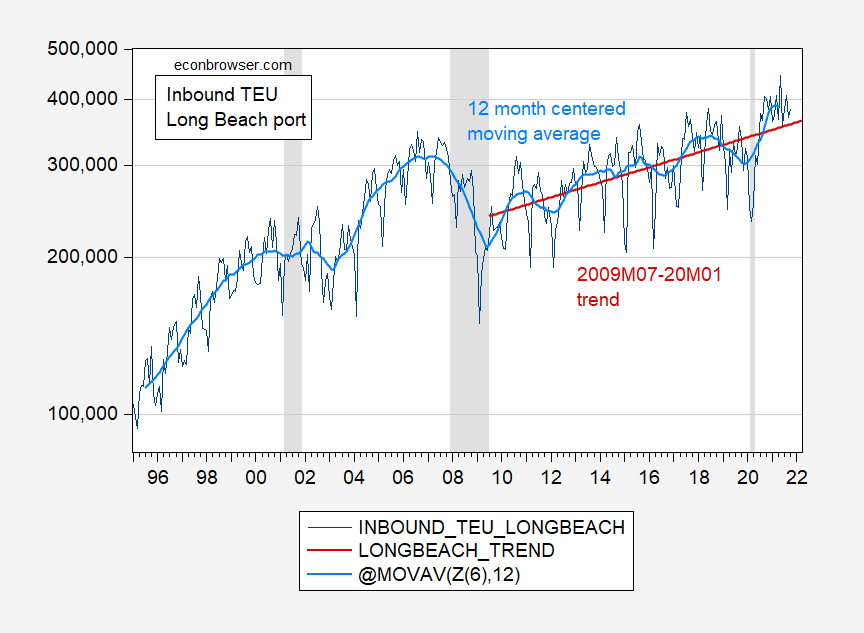
Figure 1: Inbound TEU’s, Port of Long Beach (dark blue), 12 month centered moving average (sky blue), and 2009M07-20M01 trend (red). NBER defined recession dates peak-trough shaded gray. TEU = twenty foot equivalent unit. Source: Port of Long Beach, NBER, and author’s calculations.
Inbound traffic is above trend, at least as measured by 12 month centered moving average. This is consistent with the view that elevated goods demand is driving some of the logistical issues currently being experienced.
One interesting aspect of the series is that it started declining substantially even before the pandemic struck. That in turn is consistent with tariffs biting on imports, or decelerating growth. On the other hand, outbound traffic has been off-trend for years.
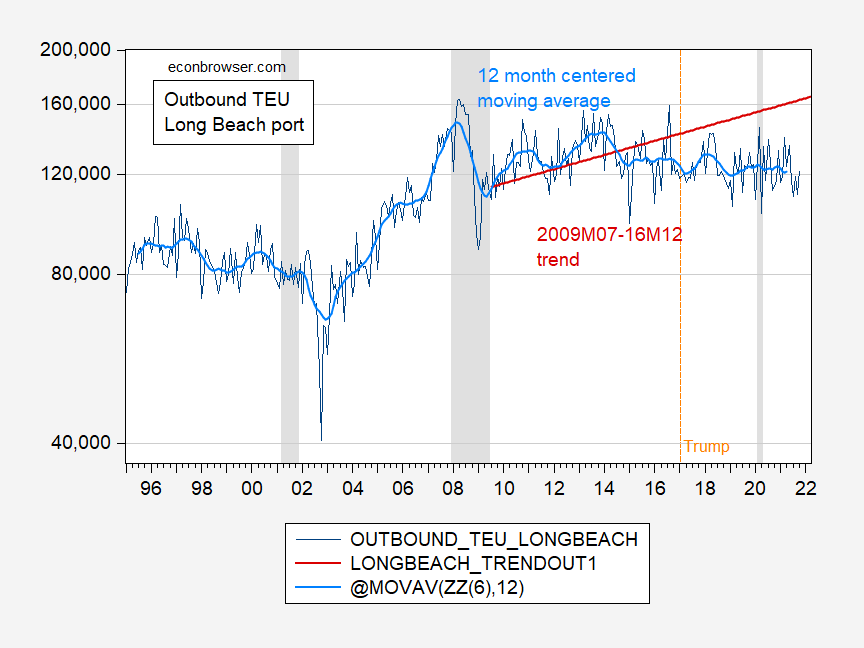
Figure 2: Outbound TEU’s, Port of Long Beach (dark blue), 12 month centered moving average (sky blue), and 2009M07-16M12 trend (red). NBER defined recession dates peak-trough shaded gray. TEU = twenty foot equivalent unit. Source: Port of Long Beach,NBER, and author’s calculations.


Comments
Log in or sign up to join the conversation.