
Weekly Forecast (August 31 - September 4, 2020)
Uptrend scenario
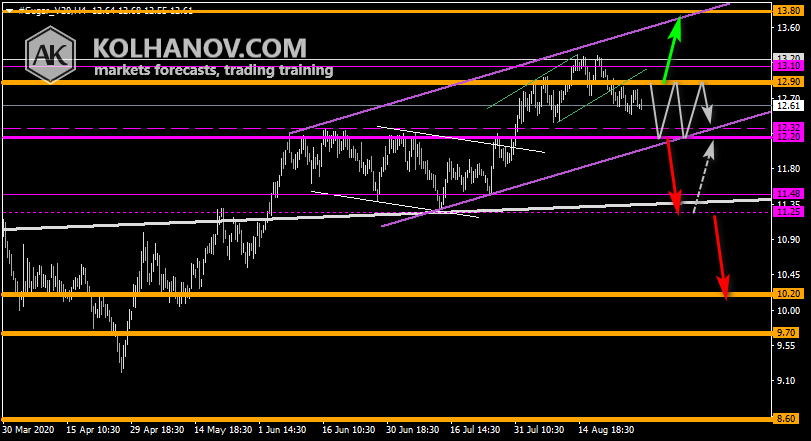
The uptrend may be expected to continue in case the market rises above resistance level 12.90, which will be followed by reaching resistance level 13.80.
Downtrend scenario
A downtrend will start as soon, as the market drops below support level 12.20, which will be followed by moving down to support level 11.25.
(Click on image to enlarge)
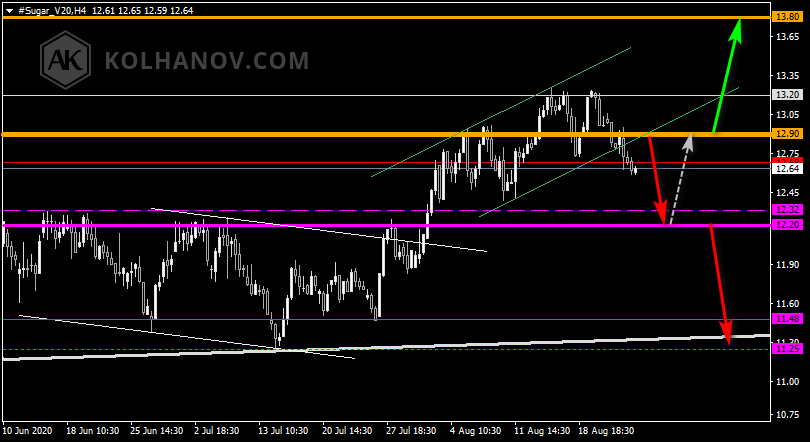
Previous week sugar price forecast chart
(Click on image to enlarge)
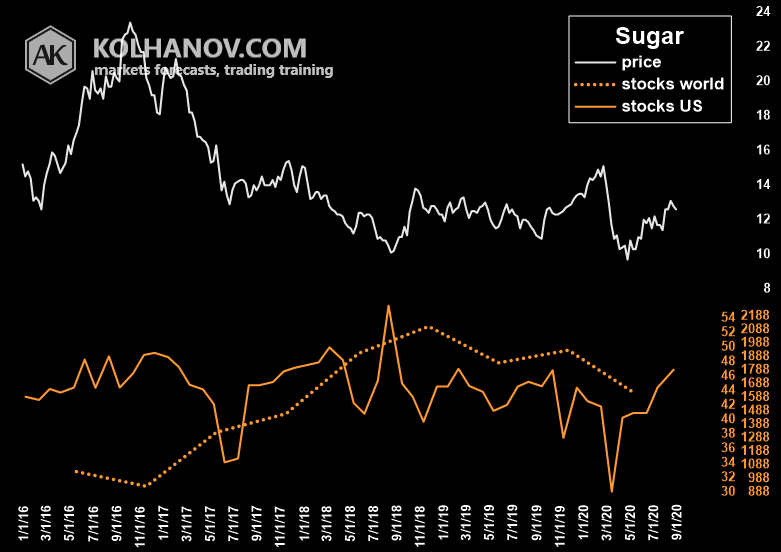
Fundamental analysis
According to fundamental analysis difference between supply and demand shows an oversold market and the fair price at the level $14.
(Click on image to enlarge)
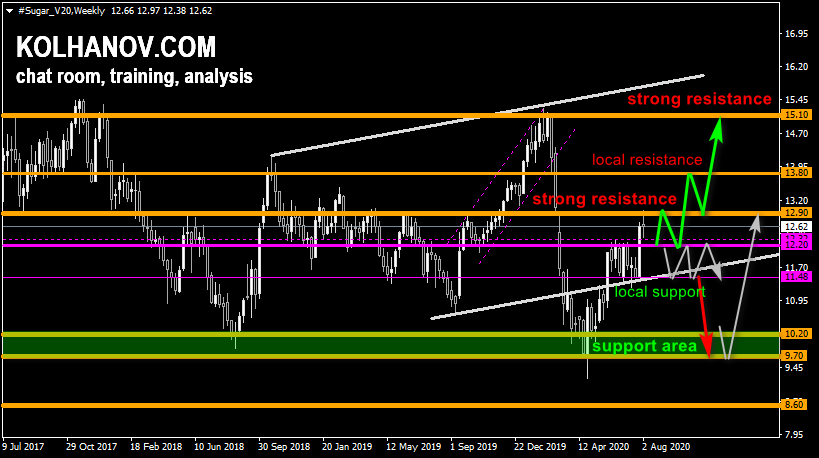
Quarterly Forecast (Quarter III: July - September 2020)
Uptrend scenario
The uptrend may be expected to continue, while the market is trading above support level 12.2, which will be followed by reaching resistance level 13.8 and 15.1.
Downtrend scenario
A downtrend will start as soon, as the market drops below support level 11.48, which will be followed by moving down to support level 10.2 - 9.7.
(Click on image to enlarge)


Comments
Log in or sign up to join the conversation.