

Trading the News: New Zealand Consumer Price Index (CPI)

New Zealand’s Consumer Price Index (CPI) is expected to hold steady at an annualized 1.9% during the last three-months of 2017, and signs of subdued price pressures may undermine the recent appreciation in NZD/USD as it encourages the Reserve Bank of New Zealand (RBNZ) to keep the cash rate at the record-low.
A batch of lackluster data prints may spark a bearish reaction in the New Zealand dollar as it encourages the RBNZ to endorse a wait-and-see approach for monetary policy, and incoming Governor Adrian Orr may keep the central bank on the sidelines throughout the first-half of 2018 as ‘underlying inflation remains subdued.’
Nevertheless, another above-forecast CPI print may fuel the near-term advance in the kiwi-dollar exchange rate as it puts pressure on the RBNZ to start normalizing monetary policy.
Impact that New Zealand’s CPI print has had on NZD/USD during the previous release
|
Period |
Data Released |
Estimate |
Actual |
Pips Change (1 Hour post event ) |
Pips Change (End of Day post event) |
|
3Q 2017 |
10/16/2017 21:45:00 GMT |
1.8% |
1.9% |
+8 |
-8 |
3Q 2017 New Zealand Consumer Price Index (CPI)
NZD/USD 15-Minute Chart
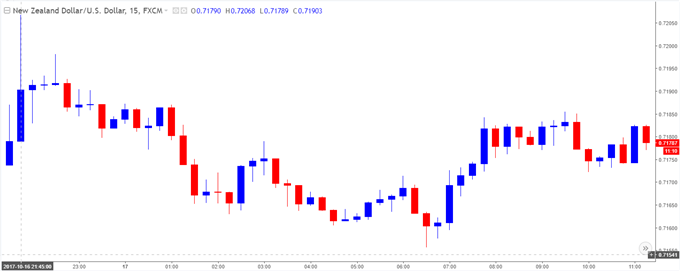
New Zealand’s Consumer Price Index (CPI) climbed to an annualized 1.9% from 1.7% in the second-quarter of 2017, with the cost of both tradables and non-tradables goods picking up during the three-months through September. The rebound in the headline reading for inflation may encourage the Reserve Bank of New Zealand (RBNZ) to drop its dovish outlook for monetary policy, but it seems as though acting Governor Grant Spencer is in no rush to lift cash rate off of the record-low as ‘headline inflation is likely to decline in coming quarters, reflecting volatility in tradables inflation.’
The bullish reaction in NZD/USD was short-lived, with NZD/USD consolidating throughout the day as the pair closed at 0.7171. New to trading? Review the ‘Traits of a Successful Trader’ series on how to effectively use leverage along with other best practices that any trader can follow.
NZD/USD Daily Chart
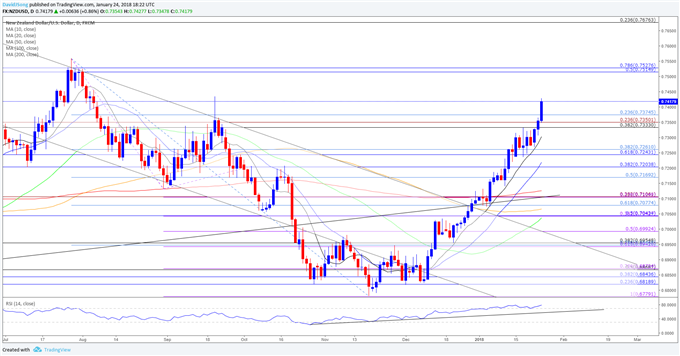
- Topside targets remain on the radar for NZD/USD as the Relative Strength Index (RSI) holds above 70, with the pair at risk of making a run at the 2017-high (0.7558) as the momentum indicator appears to be pushing deeper into overbought territory.
- A close above the 0.7330 (38.2% retracement) to 0.7380 (23.6% retracement) region opens up the Fibonacci overlap around 0.7520 (50% retracement) to 0.7530 (78.6% retracement), with the next region of interest coming in around 0.7680 (23.6% retracement).



Comments
Log in or sign up to join the conversation.