
For today’s edition of our upgrade list, we used our website’s advanced screening functions to search for UPGRADES to BUY or STRONG BUY with complete forecast and valuation data. They are presented by one-month forecast return. Lear Corporation (LEA) is our top-rated upgrade this week and it is a STRONG BUY. We also have Magna International in second place and Penske Auto Group in third. That’s three auto/truck related stocks occupying those top spots. MGA and PAG are also STRONG BUY stocks. PZN and PCRFY are BUY-rated.
|
Ticker |
Company Name |
Market Price |
Valuation |
Last 12-M Return |
1-M Forecast Return |
1-Yr Forecast Return |
P/E Ratio |
Sector Name |
|
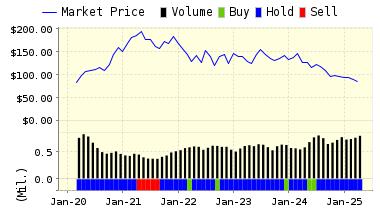
LEAR CORPORATN |
140.75 |
0.52% |
43.27% |
1.13% |
13.53% |
9.89 |
Auto-Tires-Trucks |
|
|
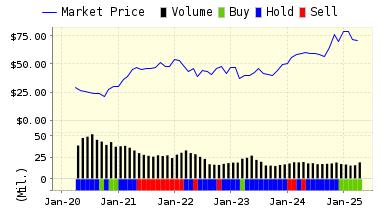
MAGNA INTL CL A |
43.58 |
-14.90% |
33.48% |
1.10% |
13.24% |
8.22 |
Auto-Tires-Trucks |
|
|
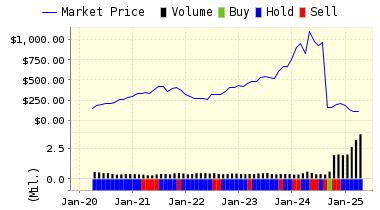
PENSKE AUTO GRP |
54.51 |
11.65% |
81.94% |
1.10% |
13.16% |
13.87 |
Retail-Wholesale |
|
|
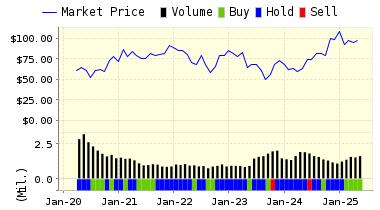
PZENA INVESTMNT |
9.76 |
-11.81% |
43.11% |
0.60% |
7.13% |
20.62 |
Finance |
|
|
PANASONIC CORP |
10.465 |
-7.81% |
20.86% |
0.57% |
6.81% |
14.29 |
Consumer Discretionary |
Below is today’s data on Lear Corporation (LEA):
Lear Corporation is a leading global supplier of automotive seating systems, electrical distribution systems and electronics. The seating segment consists of the manufacture, assembly and supply of vehicle seating requirements. The Company produces seat systems for automobiles and light trucks that are fully assembled and ready for installation. The electrical and electronic segment consists of the manufacture, assembly and supply of electrical and electronic systems and components for the vehicle. The Company is able to provide its customers with engineering and design solutions and manufactured systems, modules and components that optimally integrate the electrical distribution system of wiring, terminals and connectors, junction boxes and electronic modules within the overall architecture of the vehicle. Lear Corporation is headquartered in Southfield, Michigan.
VALUENGINE RECOMMENDATION: ValuEngine updated its recommendation from BUY to STRONG BUY for Lear Corporation on 2017-02-03. Based on the information we have gathered and our resulting research, we feel that Lear Corporation has the probability to OUTPERFORM average market performance for the next year. The company exhibits ATTRACTIVE P/E Ratio and Sharpe Ratio.
You can download a free copy of detailed report on Lear Corporation (LEA) from the link below.
|
ValuEngine Forecast |
||
|
Target |
Expected |
|
|---|---|---|
|
1-Month |
142.33 | 1.13% |
|
3-Month |
142.54 | 1.27% |
|
6-Month |
144.34 | 2.55% |
|
1-Year |
159.79 | 13.53% |
|
2-Year |
139.81 | -0.67% |
|
3-Year |
132.56 | -5.82% |
|
Valuation & Rankings |
|||
|
Valuation |
0.52% overvalued |
Valuation Rank(?) |
|
|
1-M Forecast Return |
1.13% |
1-M Forecast Return Rank |
|
|
12-M Return |
43.27% |
Momentum Rank(?) |
|
|
Sharpe Ratio |
1.04 |
Sharpe Ratio Rank(?) |
|
|
5-Y Avg Annual Return |
24.42% |
5-Y Avg Annual Rtn Rank |
|
|
Volatility |
23.55% |
Volatility Rank(?) |
|
|
Expected EPS Growth |
10.71% |
EPS Growth Rank(?) |
|
|
Market Cap (billions) |
11.16 |
Size Rank |
|
|
Trailing P/E Ratio |
9.89 |
Trailing P/E Rank(?) |
|
|
Forward P/E Ratio |
8.93 |
Forward P/E Ratio Rank |
|
|
PEG Ratio |
0.92 |
PEG Ratio Rank |
|
|
Price/Sales |
0.60 |
Price/Sales Rank(?) |
|
|
Market/Book |
5.13 |
Market/Book Rank(?) |
|
|
Beta |
1.26 |
Beta Rank |
|
|
Alpha |
0.11 |
Alpha Rank |
ValuEngine Market Overview
|
Summary of VE Stock Universe |
|
|
Stocks Undervalued |
32.46% |
|
Stocks Overvalued |
67.54% |
|
Stocks Undervalued by 20% |
13.69% |
|
Stocks Overvalued by 20% |
31.75% |
ValuEngine Sector Overview
|
Sector |
Change |
MTD |
YTD |
Valuation |
Last 12-MReturn |
P/E Ratio |
|
0.64% |
0.51% |
3.38% |
23.31% overvalued |
38.46% |
24.87 |
|
|
0.63% |
0.56% |
3.46% |
18.01% overvalued |
31.19% |
19.86 |
|
|
0.89% |
0.95% |
2.53% |
16.60% overvalued |
26.04% |
18.24 |
|
|
0.60% |
0.61% |
5.11% |
14.97% overvalued |
28.38% |
30.43 |
|
|
0.60% |
0.35% |
1.65% |
13.64% overvalued |
20.64% |
23.86 |
|
|
0.14% |
0.55% |
2.88% |
13.59% overvalued |
31.43% |
20.21 |
|
|
1.04% |
0.15% |
2.34% |
13.48% overvalued |
19.49% |
22.85 |
|
|
0.67% |
1.24% |
4.07% |
11.53% overvalued |
45.45% |
28.43 |
|
|
0.85% |
0.16% |
4.87% |
10.24% overvalued |
32.77% |
19.94 |
|
|
0.81% |
1.20% |
2.64% |
10.09% overvalued |
17.57% |
24.54 |
|
|
0.01% |
1.22% |
9.38% |
9.63% overvalued |
90.65% |
27.09 |
|
|
1.44% |
1.35% |
3.59% |
9.09% overvalued |
44.52% |
14.82 |
|
|
0.89% |
0.79% |
2.62% |
7.74% overvalued |
40.56% |
20.99 |
|
|
0.04% |
-0.03% |
1.56% |
4.22% overvalued |
22.90% |
24.35 |
|
|
0.37% |
0.47% |
-1.33% |
0.26% overvalued |
11.95% |
23.00 |
|
|
0.78% |
1.33% |
5.66% |
1.05% undervalued |
10.31% |
27.52 |
Comments
Log in or sign up to join the conversation.