


Today I’d like to introduce you to a pattern that almost no one is likely to be familiar with. I myself wasn’t aware of it until I started writing this. However, I was familiar with similar patterns–which is why I came across it. It concerns the typical performance of the S&P 500 when midterm elections take place in the U.S.
On November 3, 2026, the U.S. will hold midterm elections for the U.S. Congress. In these elections, all members of the House of Representatives and about one-third of the senators will be re-elected. Midterm elections are held every four years.
In general, elections are emotionally charged events. As a result, they can influence stock prices. For example, German stock prices tend to rise ahead of federal elections. Years ago, I wrote an article on this topic for the German edition of the prestigious Financial Times. Now, here in Seasonal Insights, I’ll show you how U.S. stocks perform during the U.S. midterms.
The midterms influence the stock market!
Take a look at the accompanying event chart. It shows the average performance of the S&P 500 over the ten trading days before and after Election Day for the last 23 midterm elections dating back to 1934–that is, following the sharp decline in the index during the Great Depression.
The red line in the middle marks Election Day. This chart shows at a glance how U.S. stock prices performed around the midterm election.
Average performance of the S&P 500 over 10 trading days before and after the midterms (1934 to 2022)
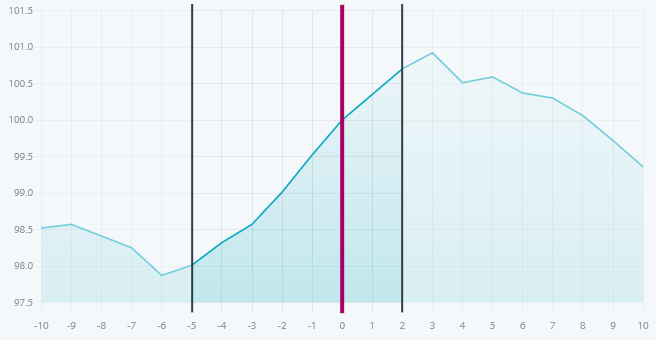
Stock prices rise on election day. Source: Seasonax | View S&P 500 Event Data
As you can see, average stock prices rose for six days leading up to the U.S. election. The rise continued for another three days afterward.
Afterward, prices fell. This means that the previous rise was not related to the typical fall rally, but was actually driven by the election.
The rise is strongest from five days before to two days after the election. This is the period we’ll examine below. It’s also marked on the chart.
The reason for this rise is likely to be emotional in nature. Elections attract a great deal of attention and generate intense internal tension. Such tension tends to be positive for stocks, a phenomenon that can also be observed during other events. In addition, many people tend to be optimistic right before an election. Regardless of the reasons, the rise is clearly triggered by these elections, as evidenced by the high accuracy rate.
A 96 percent accuracy rate!
The bar chart shows the S&P 500’s return for the past 23 midterm election cycles–every fourth year starting in 1934–during the five-day period leading up to and the two days following the midterms. The years with gains are shown in blue, and those with losses are shown in red.
S&P 500, Return in Percent, 5 Days Before Through 2 Days After the Midterms, (1934 to 2022)
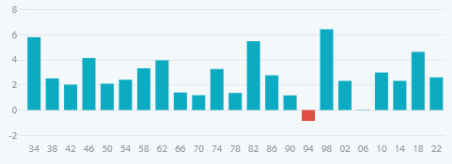
Stock prices rose with one exception (1994). Source: Seasonax | View S&P 500 Event Data
The midterm pattern is impressive: With the exception of 1994, the S&P 500 rose in all midterm elections since 1934 during the period spanning five trading days leading up to the election through two trading days afterward. In other words, it rose in 22 out of 23 cases. That corresponds to a high success rate of 95.65 percent!
The average increase was 2.74 percent. On an annualized basis, that amounts to a substantial 182.06 percent.
The trend is quite steady
Now take a look at the cumulative profit curve. It shows you how the return would have performed if you had entered the position at the closing price five days before the midterms and closed the position two days afterward.
S&P 500: Cumulative Profit Curve for Midterm Elections (1934–2022)
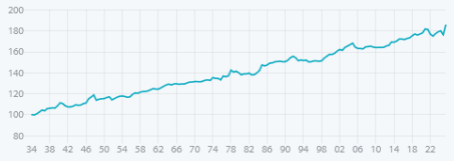
The increase is fairly steady. Source: Seasonax | View S&P 500 event data
You can see that the yield curve rises from the bottom left to the top right. The rise is nice and smooth–exactly what investors want.


Comments
Log in or sign up to join the conversation.