


Stocks dumped today in the disappointment following the Trump-Xi Summit, in which no magic solutions to Trump's dilemma with his misconceived Mideast adventures were provided.
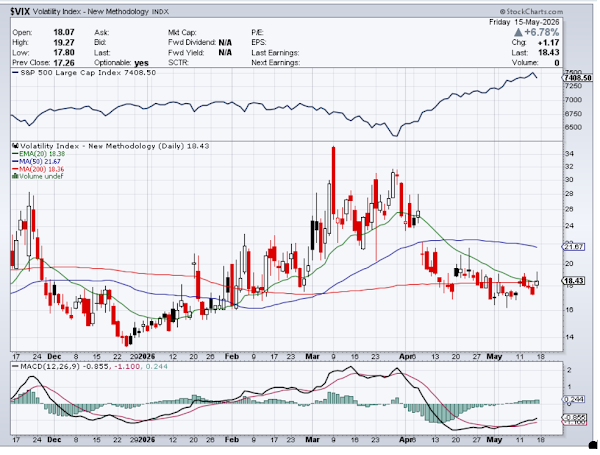
VIX ticked up to the longer term moving average, but it remains subdued, all things considered.
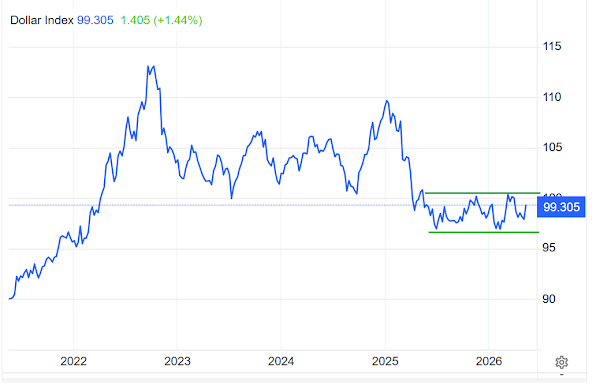
The Dollar rallied back to the top of its intermediate trading range.
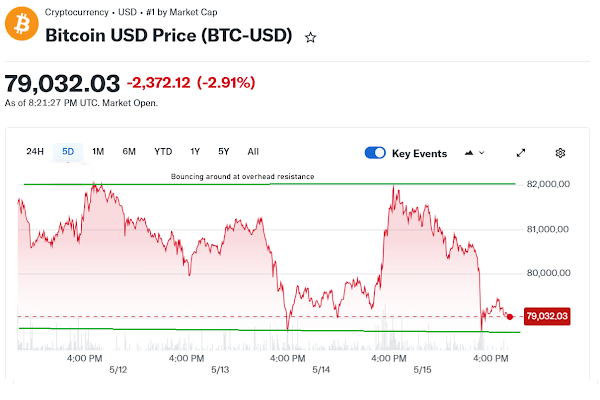
Bitcoin dumped, but is still bouncing around at overhead resistance. I have included a chart that shows this more clearly.
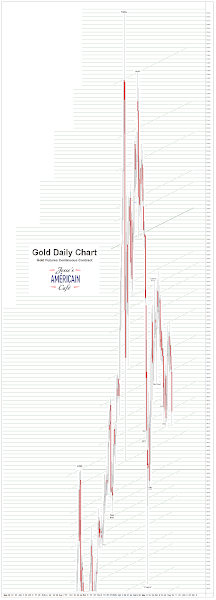
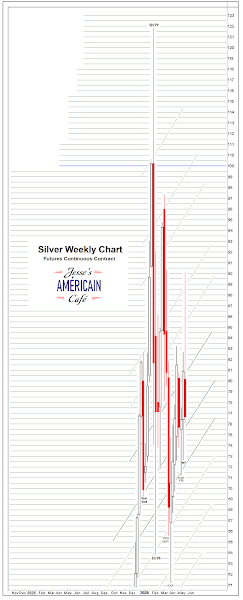
Gold and silver were hit with selling, with silver just getting hammered. Boys will be boys.
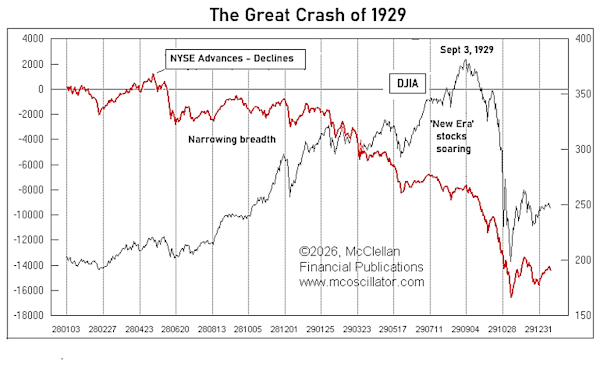
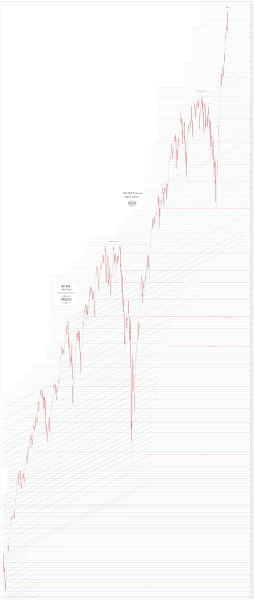
The first chart below shows how the broader market showed signs of an impending top and decliner well in advance of the 'meme stocks' of The Great Crash of 1929.
Breadth is a crossmarket indicator that seasoned traders will always keep in mind.
If not the NYSE Advance-Decline indicator, one may also keep an eye on the broader indices when a market is floating higher on narrowing leadership. As we see today.
In the 'Financial Panic' of 2007-2008, the SP 500 made its peak bubble top on October 9. But the Russell 2000 reached its peak on July 13. It had already fallen over 10% by the time the financial bubble stocks were topping.
Who could have seen it coming? If their eyes were closed, they did not.
Bubbles are difficult. It is infectious, and the relentless push higher inclines people to believe that it will keep going, and going, and going. And if not, they think they will be able to get out in time.
The Tech Bubble of 2000-2002 was essentially the same with the NDX being the lead sled dog.
Have a pleasant weekend.


Comments
Log in or sign up to join the conversation.