
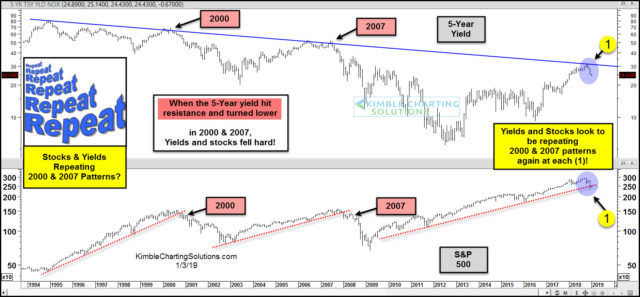
(Click on image to enlarge)
This chart overlays the S&P 500 and the Yield on the 5-year note over the past 25-years.
When Yields hit falling resistance in 2000 & 2007, they fell hard and stocks did too (50% S&P 500 declines)!
Yields hit 20-year falling resistance a couple of months ago at (1) and they are turning lower and stocks are following along.
The current pattern in stocks and yields looks to be repeating the 2000 & 2007 patterns.
Will the results be different this time???


Comments
Log in or sign up to join the conversation.