

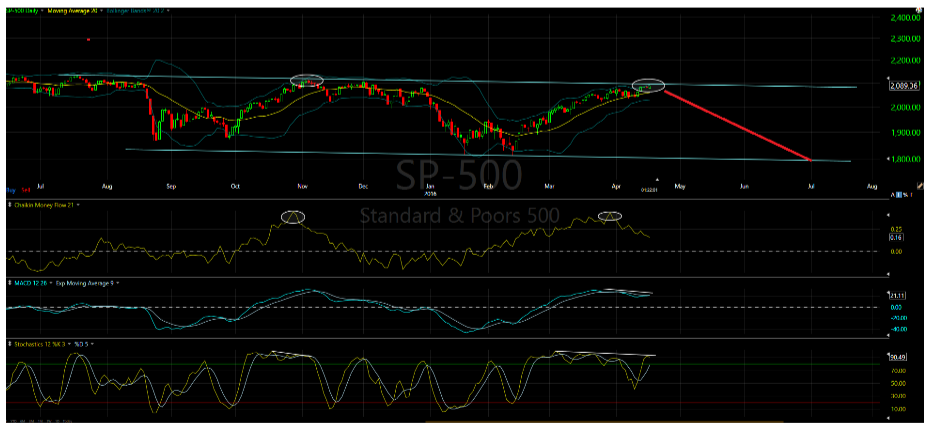
The daily S&P 500 chart shows that it is up against resistance. It also reveals that money flows have been turning south since 13 trading days ago. In early November 2015, money flows started turning negative 4 trading days before the final top. The daily MACD has snapped back up to the declining line in what may very well become a “Kiss of Death” signal. One can also see that the daily stochastics are struggling here. The probable cause of market strength recently may be attributable to tax related retirement inflows, which ended today.
We are also very near the 10 week cycle low (from February 11, 2016) last seen in early December 2015 (from late September 2015). If we copy what happened back in early December, we may see a sudden drop over the next couple of days followed by a large bounce; then further selling into the end of April.
Overall, I believe we may see the US stock market experiencing choppy topping action for the next month or so, then some hard selling as we approach June. June 3rd and 24th are possible cycle lows in June. The June lows should set up a nice summer rally before we head into the dreaded fall season.
(Click on image to enlarge)

Comments
Log in or sign up to join the conversation.