

The 'Stock Market Health Indicators' are in positive territory. This means I am willing to deploy capital into swing trades. I took several trades in the last week from last week’s stock watchlist. I hope to scan on Sunday on Monday, and will post a new watchlist then.
I am currently focusing on trading contraction breakouts. Some of these contraction breakouts are occurring from larger cup and handle patterns due to the recent price decline and then rally back toward the highs in the many stocks.
00:08:18
How the Market Indexes are Doing
I look at 4 different indexes because they each tell a different story about overall stock market health. The stock market is healthiest and swing trading stocks on the long side is most profitable when all these indexes are in uptrends. All the indexes fell in September to varying degrees, but all have rebounded recently. The rebound in all of them is good to see.

- All the indexes are in short-term uptrends.
- The NYSE and S&P 500 have recovered to their prior highs. The Nasdaq 100 and Russell 2000 have not.
- I like the NYSE Composite as it has broken to new highs. That is a bullish signal. It is a very wide assortment of stocks and it illustrates wide participation in the rally.
- Small-caps, the Russell 2000 index, remain the laggard group. This index has gone sideways since February.
- In summary, there was decent participation in the rally. A short-term uptrend was seen within long-term uptrends in most of these indexes. Not perfect market conditions, but pretty good and worth taking selective swing trades in this environment.
State of the Market Health Indicators
The following chart shows the market health indicators I track. They tell me the condition of the stock market overall, and whether it is a good time to be swing trading individual stocks.
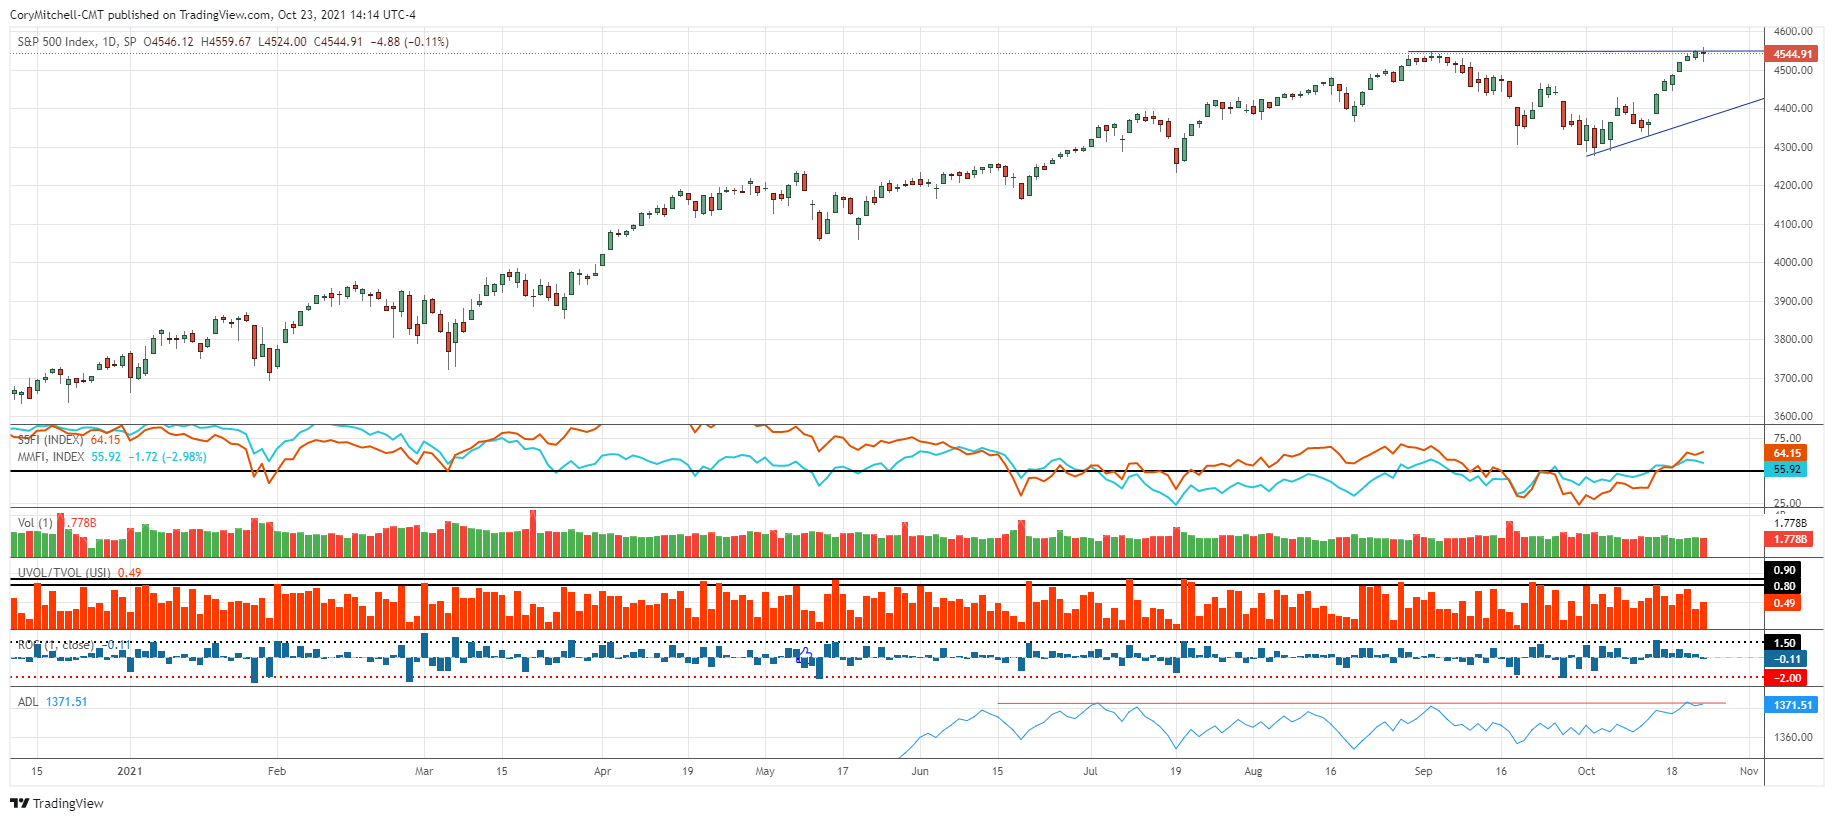
- 64.15% of S&P 500 stocks are above their 50-day moving average. 55.92% of all US stocks are above their 50-day moving average. It is generally much easier to swing trade profitably (on the long side) when more stocks are above their 50-day average. These levels indicate tradable swing trading conditions..
- Volume is flat and not a major concern right now.
- The red bars are showing Up-volume divided by Total-volume on the NYSE exchange. No important values have been seen recently. Above 0.9 or below 0.1 are values I tend to watch for.
- The blue bars are the daily percentage movement of the S&P 500. Big moves are associated with downtrends and turning points. Small values are associated with an uptrend. Values of -2 are a warning sign anytime they occur. No warning signs have been seen here recently.
- The blue line is the cumulative NYSE Advance Decline Line. This indicator is right near its high as the S&P 500 is near its high. No warning signs seen here.
How This Affects My Swing Trading
All this analysis is done on the daily charts, so I use it to determine whether I am going to take swing trades on the daily chart or not. Since conditions are favorable, with no major warning signs right now, I am willing to deploy most of my capital if I see enough valid trades that trigger me into positions.



Comments
Log in or sign up to join the conversation.