


iStock.com/VEX Collective
Technical Analysis Suggests a Stock Market Crash Could Be Ahead
A stock market crash is starting to become a likely scenario. Investors beware.
Understand that sentiment drives everything. If investors become pessimistic, they sell.
When we look at the price action of key stock indices, they suggest that investor sentiment is turning dismal and a stock market crash could become reality sooner than later.
For instance, look at the chart below of the Dow Jones Industrial Average and pay close attention to the lines drawn on the chart.
You see, over the past few weeks, we were seeing a symmetrical triangle pattern forming on the Dow Jones Industrial Average stock chart.
Symmetrical triangle patterns form when there’s a prevailing downtrend and uptrend, and at the same time, the price range is consolidating. In the chart below, the symmetrical triangle pattern is drawn.
(Click on image to enlarge)
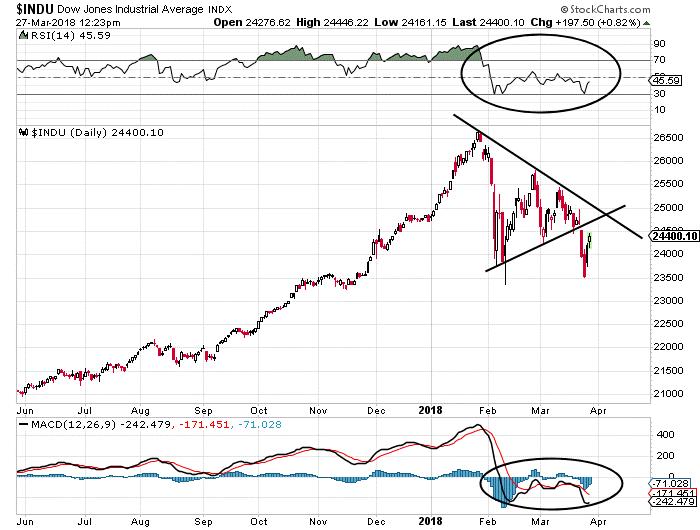
Chart courtesy of StockCharts.com
Here’s the interesting part; a symmetrical triangle pattern is one of those patterns where the direction isn’t known until the point where price breaks above or below the triangle, which is called the breakout point. The Dow Jones Industrial Average just broke below the triangle.
This is taken as a very bearish sign by technical analysts.
Remember that every chart pattern usually has targets associated with them.
With a symmetrical triangle, technical analysts usually take the widest part of the triangle and add that range to the breakout point, be it to the upside or the downside.
The widest part, in this case, was about 2,859 points.
From here, it’s simple math; if we subtract 2,859 points from the breakout point of 24,574, we could be seeing the Dow Jones Industrial Average dropping to as low as 21,715 points.
That is roughly 11.6% below where it currently sits.
If the Dow Breaks Lower, Massive Selling Could Follow
But, don’t get too far ahead just yet. If the 21,715 level is reached, it would also mean that the Dow has broken below its 200-day moving average.
Dear reader, let me just tell you that when the 200-day moving average breaks, the “big guns” come out.
Why? Because the 200-day moving average is considered a long-term trend indicator by technical analysts and traders. Usually, when the price of an asset breaks below this average, traders tend to take on bearish bets rather than bullish bets. So, this could be the case for the Dow as well, and we could see it drop further.
3 Things to Do in Case of a Sell-Off
Going forward, it’s important for readers to watch the markets very closely.
Lombardi Letter has warned its reader over the past few months that we could be headed for a stock market crash. We talked about sell-offs when everyone else was turning extremely bullish and forecasting key stock indices to shoot through the roof.
With all this said, we believe at this point, there are three things investors could be doing:
- Focus on capital preservation. This means setting stops and taking some profits off the table.
- Follow markets closely. They have been wild for a while and trading ranges could get extreme.
- Go bargain hunting. In times of sell-off, investors sell anything and everything in sight. They sell companies with great fundamentals. So, it might be the time to look out for opportunities.


Comments
Log in or sign up to join the conversation.