

Image Source: Tyler Prahm on Unsplash
Volume profiling provides unique insight into the profit-and-loss position of recent traders by identifying price levels at which significant buying and selling have occurred. The current volume profile analysis for the State Street SPDR S&P 500 ETF Trust SPY highlights that many people are trapped in the market with losses, warns Lance Roberts, editor of the Bull Bear Report.
Areas of high volume can act as powerful support and resistance levels because they represent prices at which a large number of investors have established positions and are therefore likely to defend those positions or exit them if prices return to those levels.
Equally important are the low-volume price ranges where little trading occurred. These areas have the potential to create price gaps, where prices can move quickly with little friction.
State Street SPDR S&P 500 ETF Trust Chart
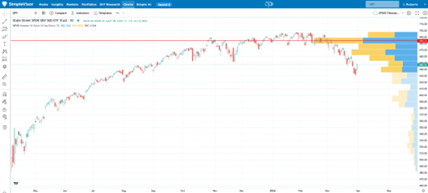
In the chart here, the red line (a.k.a. the POC, or Point of Control) indicates the price level with the most volume within the visible price range. The gold and blue colors indicate whether the volume was up or down (blue for up volume, and gold for down volume).
The color coding helps you better understand whether the buyer or the seller initiated the transaction. The darker bars represent 30% of the volume since the April Liberation Day lows.
We suspect the market will encounter resistance all the way up to new highs as these investors who are losing money seek to exit their trades at no profit or with a slight gain or loss. Below 630, the volume starts to thin out. This means there are not many buyers willing to add to their positions to provide support.
Said differently, it could be a slippery slope lower if new buyers are shy.
About the Author
Lance Roberts has been involved in the investing world for more than 25 years. From private banking and investment management to private and venture capital, he has pretty much been there and done that.
Mr. Roberts common sense approach and real world examples have appealed to a broad investing audience for two decades. He is the chief investment strategist for RIA Advisors and lead editor of the Real Investment Report, a weekly subscriber-based newsletter distributed to over 100,000 people nationwide. The newsletter covers economic, political, and market topics as they relate to your money and life.


Comments
Log in or sign up to join the conversation.