
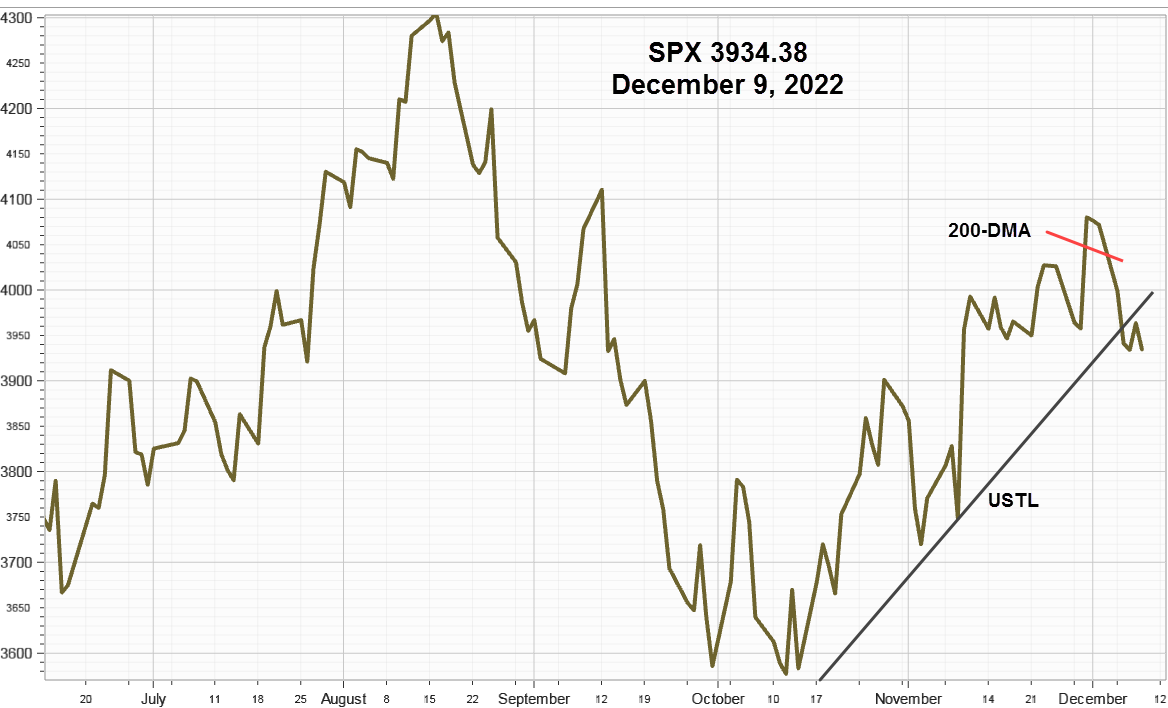
Those bulls still roaming global equity markets on Friday were delighted by a better than expected U.S. employment report that sent the bears and hedgers scrambling to cover and unwind short positions after the S&P 500 Index gapped up at the opening. While it appears, the pullback that had been underway ended on Friday, only a close above the November 27 high will confirm the bullish view. A mark-to-market update for the active SPDR S&P 500 ETF (SPY) put spread hedge follows the Market Review along with an earnings report calendar spread idea for Oracle (ORCL).
S&P 500 Index (SPX) 3145.91 gained 4.93 points or +.16% for the week after gapping higher at the open on Friday and then closing up 28.48 points. However, the reported combined volume of 1.7 bn shares failed to exceed the weekly average. December seasonal optimism may emerge after the advance on Friday ended a brief pullback and could last until yearend unless derailed by a failure to reach a phase one China trade agreement before December 15, when new tariffs begin.
Confirmation the pullback ended and the uptrend resumes, requires a close above the November 27 high of 3,154.26, only 8.35 points away. While a small double top like those in July and September are possible, seasonal optimism will likely prevail. In the event of unfavorable China trade news, the 50-day Moving average at 3042.13 marks the first support area.
CBOE Volatility Index® (VIX) 13.62 gained 1.00 point or + 7.92% last week. Our similar IVolatility Implied Volatility Index Mean, IVXM using four at-the-money options for each expiration period along with our proprietary technique that includes the delta and vega of each option, added .83 points or +8.16% to end the week at 11.00% vs.10.17% for the week ending November 29. The chart below shows the 52-week low made on Tuesday, November 25 at 9.12%, along with the recent attempt to move back toward the mean as SPX pulled back.

VIX Futures Premium
This next chart shows as our calculation of Larry McMillan’s day-weighted average between the first and second-month futures contracts.
With seven trading days until December expiration, the day-weighted premium between December and January allocated 35% to December and 65% to January, for a 14.92% premium, still in bullish green zone, vs. 19.13% for the week ending November 29.

The premium measures the amount that futures currently trade above or below the cash VIX, (contango or backwardation) until front month futures contract converges with the VIX at expiration on Wednesday, December 18.
For daily updates, follow our end-of-day volume weighted premium version located about halfway down the home page in the Options Data Analysis section on our website.
Hedging Strategy
Mark-to-market for the long SPDR S&P 500 ETF (SPY) put spread from Digest Issue 46 "VIX Correlation Indicator Confusion [Charts]" booked for 1.70. (Long one Jan 17 305 put and short on Jan 17 295 put). After SPX gained 2.85 points on Friday to close at 314.87, the spread ended at 1.34, for a decline in value of .36.
Viewed as a hedging cost like insurance against a large decline, alternatives include:
-
- Close it now, since SPY likely continues higher and will soon be making new closing highs again.
- Hold it until after the December 15 China trade tariff deadline.
Since the additional cost will likely be modest compared to the potential in the event of no trade agreement, alternative two seems consistent with the objective to hedge risk.
Earnings Calendar Spread
Here are the top five ranked by IV/HV ratios from Friday, a regular complimentary feature found in the Rankers and Scanners section of our home page about one-half way down on the right at ![]()

A court battle over the proposed merger with T-mobile eliminates Sprint (S) from consideration, with the highest ratio at 2.99.
No earnings reports eliminate XLP, number 2 at 2.83.
At number 4, ArQule (ARQL), biotech with binary risk, also eliminated.
At number 5, Lululemon Athletica (LULU) scheduled to report on Wednesday, December 1, looked interesting, but at new highs, with high near term implied volatility well above the IV Index Mean of 41.61%, the potential for a large move on the report date disqualified it from further consideration since large price moves hurt long calendar spreads.
That leaves number 3, Oracle (ORCL) scheduled to report on Thursday with an IV Index Mean of 26.12%, a 30D HV of 9.53%, and IV/HV ratio of 2.74 as the best calendar spread choice.
Oracle Corporation (ORCL) 54.83, down 1.31 points or -2.33%, now near the middle of its range between July and September. Consider this implied volatility calendar spread idea.

With good implied volatility edge, the debit was .43 on Friday. Check the prices and implied volatility again on Wednesday afternoon then be prepared to close it Friday afternoon after the implied volatility of the December 13 call declines.
Macro-Economic Thoughts and Question
"It's not the economy, it's the liquidity, stupid!" – Anonymous
Consider: If the Federal Reserve purchases 100% of the T-bills at auction does that translate into monetization as in Modern Monetary Theory?
Send your thoughts in the Comments section below the web version. All answers will be posted.
Summary
Friday's S&P 500 Index advance after a better than expected employment report most likely ended the pullback although new highs are required to confirm resumption of the uptrend. While the VIX futures and option indictors remain bullish, they retreated somewhat last week. Uncertainty about a China trade agreement before the December 15, when additional new tariffs are scheduled to begin, justifies retaining the long Jan 17 out-of-the-money SPY put spread as portfolio insurance.
Comments
Log in or sign up to join the conversation.